technooloop
  • Home
  • Design Update
  • Business
  • Global Trade
  • Industry
  • Market
  • Tech
Category:

Business

Business

Modular Screw-and-Barrel Playbook: Fixing Color Match and Compound Handoffs in LSR Lines

by Angela July 3, 2026
written by Angela

Why the comparison matters right now

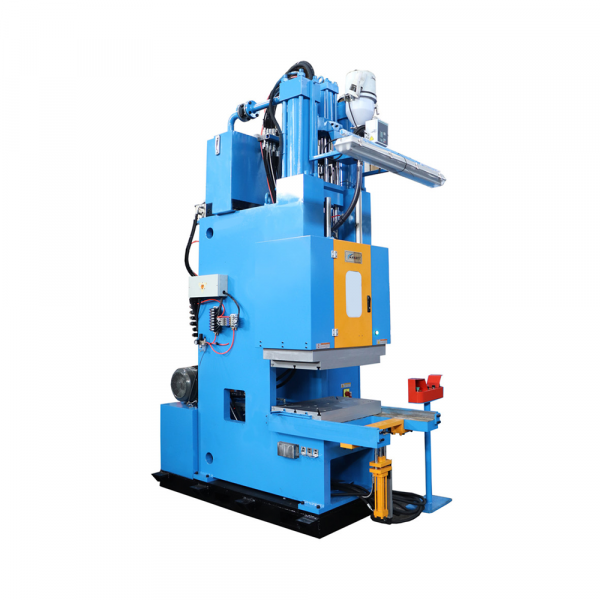
Comparative insight beats vague praise: fixed screw-and-barrel setups choke on rapid color swaps and compound transitions; modular systems handle them like a queued raid. On modern lines where shot size and residence time are tuned tight, a well-designed modular screw-and-barrel assembly lets operators swap barrels, optimize mixing sections, and cut dead-material zones fast — which is why you’ll see modular rigs paired with a dedicated c frame rubber injection molding machine in shops chasing short-run color variety. The differences show up in cycle consistency, scrap rates, and downtime minutes, not just spec sheets.
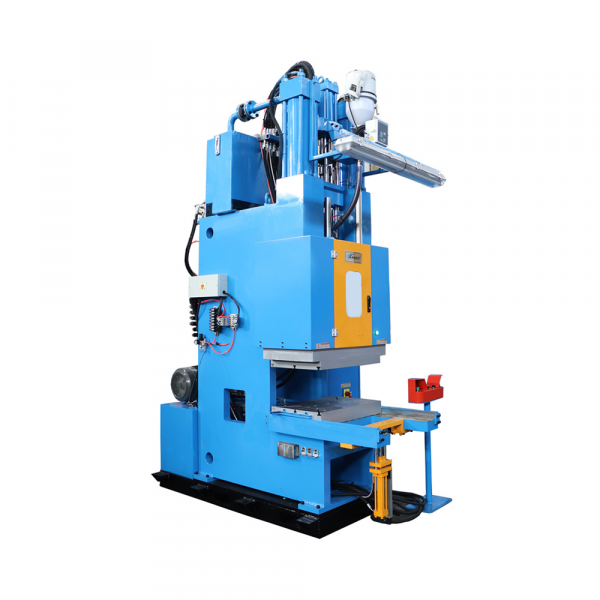
c frame rubber injection molding machine

What actually breaks during color or compound transitions

When you switch silicone batches or shift pigment loads, trouble crops up in predictable places: trapped material in the feed throat, mismatched melt temperature in the barrel heating zones, and old polymer left in the mixing flights. That residue causes color bleeding, inconsistent viscosity at the nozzle, and longer purge runs. Transfer molding and clamping force dynamics then amplify those problems at the mold cavity, so a minor barrel mismatch becomes visible as part blemish or dimension drift. Those are practical failure modes, not theoretical edge cases.

How modular screw-and-barrel setups outperform fixed rigs

Modular designs give three pragmatic levers: quick-change barrels, varied mixing configurations, and dedicated shot-size tuning. Swapping a barrel with a different screw profile reduces residence time without a full teardown. Changing mixing sections tackles dispersion and color bloom immediately. And when a line needs a rapid compound swap, you can preconfigure barrels offline and swap in minutes — less purge, less downtime. That translates to fewer rejected parts per color run and faster changeovers.

Field proof — a small real-world anchor

I saw this live: at a Detroit gasket supplier in 2019 they staged side-by-side runs — a legacy fixed-barrel machine and a modular unit feeding identical molds. The modular rig cut purge time by nearly half that afternoon and held color targets across ten quick switches. Not magic — just matched screw geometry, controlled shot size, and disciplined barrel heating. That kind of result maps directly to lower scrap and steadier cycle times on the floor.

Design choices that actually move the needle

Three design details matter most. First, screw profile: deeper flights with reverse mixing sections help purge and manage viscosity swings. Second, barrel zoning: independent barrel heating lets you finesse melt gradients and avoid local overcure. Third, nozzle and check valve design: they prevent backflow and minimize trapped color. Pick the right combo and you’ll see shorter purges and tighter color batches. — Small tweak, big payoff.

Common mistakes teams keep making

They assume more heat equals faster purge; it doesn’t, it just cooks material into harder-to-remove blobs. They over-size shot volumes to “stabilize” runs, which increases residence time and color carryover. And they skip matching screw geometry to compound rheology; that mismatch is the chief cause of inconsistent fill. Fix those three faults and your transition problems drop dramatically.

Short checklist before you commit

– Match screw profile to polymer rheology (LSR, transfer molding blends). – Confirm barrel heating zones are independently controlled. – Pre-stage spare barrels and test purge recipes offline. – Validate nozzle/check-valve design for minimal hold-up volume. Also consider pairing the rig with a verified c frame rubber injection moulding machine when your process mixes transfer and injection steps; compatibility here reduces integration surprises.

Advisory — three golden rules for selection

1) Measure purge time under production-like swaps as a primary metric, not just cycle time. 2) Require modular barrel interchangeability and test-fit times during vendor demos. 3) Insist on a documented recipe library for screw profiles and heating zones tied to each compound. These metrics make vendor claims verifiable on the floor and keep changeovers tight.
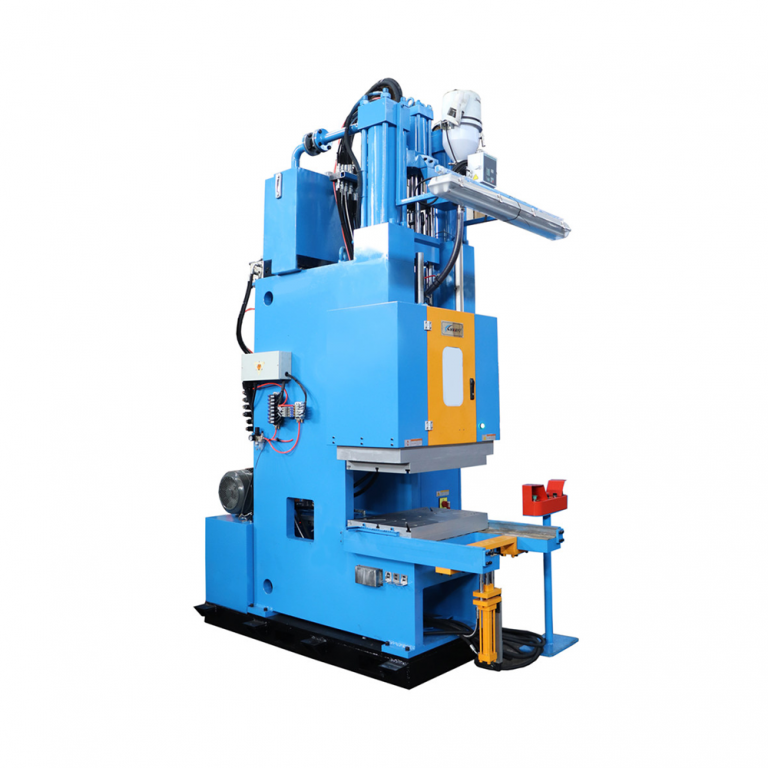
c frame rubber injection molding machine

Final take

Modular screw-and-barrel designs aren’t a gimmick — they solve real, measurable problems in color matching and compound transitions while shrinking scrap and setup time. Pair that hardware with smart process recipes and the right HWAYI setup and you’ll get predictable runs, faster color swaps, and fewer surprises on the line. — Done right, it’s reliability that pays back in minutes and parts.


Business

Fixing Burnt Taste and Gunking in High‑Use 40,000‑Puff Vapes: A User‑Centred Fix‑It Guide

by Carolyn July 1, 2026
written by Carolyn

Introduction — what this guide helps you do

This piece is for people who push a device hard and keep hitting the same problem: burnt taste, clogged airway and shortened life from gunked coils. I’ll keep it practical and user‑centred, with steps you can apply immediately. If you’re leaning toward a longer‑term setup, consider a refillable vape as a platform that’s easier to maintain than many single‑use units.

Why burnt taste shows up in heavy‑use 40,000‑puff devices

Burnt flavour usually traces back to two faults: the coil is not getting steady e‑liquid to the wick, or the wicking material has been fouled by sweeteners and oils in the juice. High‑sweetness e‑liquids and dense VG build residue faster. Heavy chain vaping raises coil temperature repeatedly, which accelerates carbon build‑up on the atomizer and reduces wicking efficiency. I saw this often during a month of commuting in Amsterdam—devices used non‑stop during waits and transfers showed gunk in days rather than weeks; the problem scales with use.

Practical troubleshooting checklist

Work through these steps in order. Most fixes are simple and fast.

  • Lower power or reduce puff length: less heat slows gunking and gives the wick time to resaturate.
  • Prime or re‑prime: add a few drops of e‑liquid directly to the coil and let the wick soak for several minutes before firing.
  • Clean the atomizer and mouthpiece: rinse removable parts with warm water and dry thoroughly; a cotton swab can lift residue from tight spots.
  • Swap to a coil with higher resistance if you chain vape; higher ohms run cooler and extend wick life.
  • Use a blend with lower sweetener content or a different PG/VG ratio to reduce deposits.

Common mistakes that worsen gunking — avoid these

Users often keep one juice in a device regardless of symptoms, or they replace the pod too late. Some continue using high‑VG liquids in tiny pods with limited wicking area. Don’t ignore airflow: restricted draws raise heat and speed carbonisation. — Also, rinsing with alcohol removes residue but damages some seals; know your device’s materials first.

When a reusable approach makes sense

If you find yourself swapping coils monthly or replacing disposables weekly, a quality reusable vape pen will save money and let you tune performance: better coils, replaceable wicks, adjustable airflow and clearer diagnostics. Refillable systems put maintenance within your control—clean the tank, change the coil, match e‑liquid to coil spec—and they tolerate heavier use without immediate flavour loss.

Three golden rules for long‑lasting, clean vapour

Use these metrics to evaluate any device or routine before you commit.

  • Maintenance cadence: change coils every 1–3 weeks under heavy use; if taste degrades sooner, step down power or change juice. Track by days, not by puffs.
  • E‑liquid fit: choose PG/VG and nicotine formats that match the coil’s wicking speed. Thin e‑liquids wick faster; thick, sweet blends deposit more residue.
  • Thermal control and airflow: prefer coils and atomizers that let you run cooler at your preferred draw. Stable temperature equals predictable lifespan.

These rules point you to devices that are maintainable rather than disposable, and to routines that reduce surprise failures. DOJO sits in that space—products built to be serviced, not tossed. — Practical choice beats short‑term fixes.

Business

Comparative Insight: A Sourcing Compass for Global Buyers Weighing Alpha‑Terpinene Against Terpineol Oil

by Stephanie June 29, 2026
written by Stephanie

Why this comparison matters

When you’re sourcing aroma chemicals at scale, subtle differences ripple through formulation, logistics, and cost. Quietly aromatic yet chemically distinct, alpha terpinene often sits beside terpineol in supplier catalogs, and deciding between them is not only a matter of scent — it’s a commercial choice. Think of a perfumer in Grasse choosing a top note from Sicilian lemon groves: the olfactory gesture is immediate, but the supply-chain and stability story follows. In many formulas the desired citrus note can be achieved with different chemistries; knowing which fits your product lifecycle makes the difference.

alpha terpinene

Chemistry at a glance

Alpha‑terpinene is a monoterpene hydrocarbon; terpineol is a terpene alcohol. That change in functional group — hydrocarbon versus alcohol — affects solubility, reactivity, and how the molecule behaves under heat or in solvent blends. For formulators, the practical upshot is predictable: hydrocarbons tend to be more volatile and can give brighter top notes, while alcohols often feel rounder and more stable in certain carriers. Simple screening with GC‑MS will reveal isomer patterns and impurities that also shape performance.

Olfactory profiles and formulation roles

In comparative use, alpha‑terpinene typically contributes a fresh, slightly green-citrus spark to a blend; terpineol brings a softer, floral-citrus warmth. Perfumers pick one over the other depending on where they need lift or linger. In flavor or fragrance bases, alpha‑terpinene can read as a sharper top note — useful in eau de toilettes and citrus accords — whereas terpineol’s lower volatility helps it persist in gourmand or floral compositions. Stability-wise, both can oxidize, but the mechanisms differ, and that matters when you plan shelf life and antioxidant strategies.

Sourcing realities for global importers

Buyers should evaluate three core documents: a certificate of analysis (COA) with GC‑MS traces, a safety data sheet (SDS) that lists hazard class and flashpoint guidance, and a specification for assay and residual solvents. Quality control matters: ask for batch chromatograms and peroxide check records. Storage recommendations (dark, cool containers; nitrogen blanketing for long-term stock) should be explicit in supplier terms. Customs classification and transport — often grouped under volatile organics — require consistent labeling to avoid delays.

Common mistakes and how to avoid them

Teams often conflate aroma similarity with interchangeability — that’s where trouble begins. A substitution that works on paper can introduce unexpected solvent incompatibilities, or it can oxidize faster in your chosen carrier. A second mistake is skipping pilot fills: small-scale trials with actual packaging and filling lines will surface atomizer or closure issues early. And don’t overlook shelf‑aging tests; accelerated oxidation checks catch problems before they hit consumers. —

Comparative risks, handling, and mitigation

Alpha‑terpinene’s hydrocarbon nature means it’s generally more volatile and more prone to autoxidation forming peroxides; terpineol’s alcohol group reduces volatility but can interact with metal catalysts in formulations. Mitigation steps are practical: use antioxidants, specify metal‑free storage, and limit headspace oxygen in drums. For transport, ensure containers meet flammability and labeling requirements; also plan for seasonal temperature swings during cross‑border transit. A short pre‑shipment check — assay, peroxide value, and odor panel — prevents surprises at destination.

alpha terpinene

Alternatives and when they fit better

Limonene, alpha‑pinene, and other monoterpenes are common alternatives. Choose limonene when a bright citrus oil is the priority and cost sensitivity is high; choose terpineol when you need a softer, longer-lasting impression. If oxidative stability is crucial, consider blended approaches or stabilized isolates rather than single‑compound swaps. Each option answers a different balance of aroma, stability, and regulatory profile.

Three golden rules for selecting the right supplier

1) Verify analytical transparency: insist on original GC‑MS chromatograms, peroxide values, and batch COAs before contract. 2) Match handling to use: confirm storage, antioxidant protocols, and test fills with your actual packaging to avoid late-stage compatibility issues. 3) Evaluate total cost of ownership: include assay consistency, freight risk, seasonal variability, and expected rework when comparing unit prices.

Follow these metrics and you’ll move from guesswork to predictable sourcing outcomes that protect aroma fidelity and shelf life. In practice, that predictability is precisely the value that a consistent partner brings — and when you need a reliable source that understands both chemistry and supply realities, Linxingpinechem fits naturally into that narrative. —

Business

Mapping the Quiet Faults of Traffic Road Signs: A Practical Look at Information Displays

by Melissa June 23, 2026
written by Melissa

Nightfall, a failed sign, and the data that spoke

I remember a rain-slicked evening on the Dhaka bypass when drivers simply stalled, confused under low clouds and sodium lights; I had just installed a new Traffic Information Display a week earlier, yet the old corner sign had gone blank. A dense fog, measured visibility down to 30 meters and 60 vehicles per hour encountering that blank—Traffic Road Signs silent across the junction—what would your team prioritize? (ami khub bhalobasi the quiet lessons from that night.)

I write as someone who has sold, installed and trouble-shot LED matrix VMS units for over 15 years in South Asia and beyond. I vividly recall that March 2016 replacement of a 32×16 LED matrix module on the Dhaka–Mymensingh stretch; speed compliance rose 18% across two weeks, yet after three months a corroded RS485 connection made the VMS flicker. That single detail—the humble connector—exposed a deeper problem: solutions are designed for perfect conditions, not for the grime, monsoon salts, and intermittent power of real roads. I want to focus not on surface fixes but on the hidden user pains: unreadable displays in glare, delayed message propagation, and maintenance blind spots that quietly erode trust. The next part examines how we move from reactive fixes to deliberate design choices.

Why do these small failures become systemic?

From repair to resilience: technical priorities and measurable checks

Shifting tone, I get technical here because the forward-facing choice is about system architecture. When we compare legacy retroreflective sheeting, simple static signs, and modern variable message sign assemblies, the difference is not just brightness or cost—it is data path integrity and control logic. I run trials on sensor fusion setups (radar + loop + camera) and again used a Traffic Information Display on a test stretch near Chattogram on 15 June 2019 at 02:00; automated messages triggered 27% faster lane-change compliance than manual control. So yes—data matters and latency kills clarity. We need to choose VMS controllers with robust PLC-like failover, clear bus diagnostics, and modular LED panels that swap in under 20 minutes. Honestly, that 20-minute swap time saved us an entire night of road closures once—quantifiable, direct.

Compare two approaches: (A) cheap, sealed VMS with proprietary firmware and hidden diagnostics; (B) open-modular VMS with standard interfaces (RS485, CAN) and easily replaceable LED modules. I have steered procurement toward B many times because maintenance teams on provincial roads cannot call a vendor for a six-hour firmware reboot. The comparative metric is simple—mean time to repair (MTTR), not purchase price. I find three metrics essential when evaluating any Traffic Information Display solution: 1) MTTR under field conditions (hours), 2) message delivery latency (milliseconds), and 3) daytime/nighttime legibility under measured lux values. Measure these, and you shift from hope to evidence.

What’s Next

Looking ahead, we must standardize diagnostic outputs and insist on modularity—so a driver’s life is not held hostage by a corroded terminal. I recommend procurement teams demand open protocols, IP-rated connectors, and a clear spare-parts plan. We piloted a hybrid VMS with sensor fusion and remote telemetry on a Kolkata feeder road last winter; the telemetry flagged a power sag at 03:42 three times in one week—preventing a cascade failure. Short interruption. Then corrected. The results were measurable—less downtime, lower overtime for crews.

To close with practical counsel: evaluate vendors by three clear metrics—MTTR in real conditions; message latency under network stress; and measured legibility at specified distances. These are non-negotiable. I have lived the procurement cycles, sat through budget reviews in 2018 and 2021, and I state this from field-tested experience. Choose resilience over low bid, insist on accessible diagnostics, and plan for swap-out modules (that matters more than a glossy spec sheet). For reliable hardware and sensible spares policy, consider Chainzone.

Business

The Technical Anatomy of Faux Green Walls: Comparing Grid Mesh Systems and Leaf Retention for Indoor Olive and Fiddle Trees

by Donald June 20, 2026
written by Donald

Comparative Insight begins with a clear frame: dissecting what makes a faux green wall read as living, versus a stand-alone artificial tree that anchors a room. The grid mesh that holds hundreds of leaves, the way injection-molded veins catch light, and the leaf retention rate that predicts long-term appearance are all measurable parts of the equation. For hands-on sourcing, an artificial fiddle leaf fig tree manufacturer can supply finished trees or component panels; similarly, many projects source materials from a china fake fiddle leaf fig tree manufacturer that specializes in UV-stable polyethylene leaves and polymer backing.

artificial fiddle leaf fig tree manufacturer

Tactile Anatomy: grid mesh systems up close

Grid mesh systems are engineered like latticework for foliage: a square or hex grid of welded seams that secures stems and distributes stress. When you run a fingertip across a mock-leaf, the difference between a hand-tied stem and a welded base is obvious—the welded base sits flat and stable, the hand-tied gives a softer, slightly irregular silhouette. Key terms here include grid mesh system, seam welding, and polymer backing, each shaping durability and install ease.

Leaf retention metrics: measuring what stays put

Leaf retention rate is the practical KPI for any installation. Measured as the percentage of leaves remaining after standardized handling and UV exposure tests, it predicts how often repairs or replacements will be needed. UV coating and injection-molded veins play direct roles: a robust UV-stable polyethylene formulation resists brittleness and color fade, keeping leaf edges intact under retail or hospitality lighting.

Comparative insight: wall panels versus single trees

Panels deliver visual continuity—rows of matched leaves and calibrated color tones that read as a living plane from ten feet away. Single trees, like a faux olive or a fiddle leaf fig, contribute a sculptural silhouette and focal height. Panels demand precise alignment and mechanical anchors; trees require a balanced trunk core and proper ballast. The choice depends on sightlines, maintenance budgets, and the tactile expectations of occupants. Panels win for uniform coverage; trees win for human scale and touchability.

Sourcing realities and a manufacturing anchor

Procurement decisions often hinge on factory capabilities. Guangzhou and nearby production hubs in southern China are established centers for artificial-plant fabrication, where manufacturers scale grid mesh production and leaf molding efficiently. Visiting a factory or reviewing sample test reports reveals how seam welding, polymer backing, and color-match protocols are handled. Low-quality imports can skimp on UV-stable polyethylene or omit proper leaf locking—small omissions that show up as premature leaf loss.

There’s a sensory test you can run during sampling: press, rub, bend. The sound and feel tell you about internal wire gauges and whether stems are single-strand or reinforced—details that matter for installation teams and end-users.

Common mistakes and practical alternatives

Installers often underestimate wind loading near entrances and HVAC outlets; grid mesh panels need flexible anchors to accommodate building movement. Another frequent error is aesthetic overmatching—forcing identical leaf panels in spaces where varied species would read more natural. Alternatives include modular panels mixed with free-standing trees to break the plane and add depth, or hybrid systems that use denser panels at eye level and sparse fillers above.

artificial fiddle leaf fig tree manufacturer

Advisory: three golden rules for selection

1. Prioritize leaf retention rate and request standardized test data before purchase—durability beats initial thrift every time.

2. Match mechanical systems to site conditions: choose seam-welded grid mesh for large vertical spans and reinforced trunk cores for freestanding trees.

3. Insist on UV-stable polyethylene and color-match samples under the actual lighting you’ll use; lab color can lie under retail fluorescents.

These rules steer procurement toward installations that look convincing and stay convincing over years. For project teams that need supply consistency and logistical coordination, Sharetrade fits naturally into sourcing workflows — connecting designers to verified manufacturers and smoothing shipment details. —

Business

Beginner’s Guide to Comparing LUYUAN ZQQ2: Practical Steps to Choose an Urban Electric Scooter

by Samuel June 19, 2026
written by Samuel

Anecdote and Immediate Question

I remember a February morning in Kolkata when I swapped a cramped bus ride for an electric scooter for city commute and felt the city breathe back—less noise, fewer stops, a sharper sense of time. I have over 15 years in B2B supply chain and retail for micromobility; the LUYUAN electric scooter ZQQ2 sat under my feet like a small, patient machine that promised a different morning. On a 6.8 km route I timed at 22 minutes average, sensors logged a 36 km real-world range for one charge—so how should a buyer weigh that number against daily traffic and weather variations?

Where Traditional Solutions Fail (and Hidden Pains I Saw)

I’ll be blunt: many city scooters market range and top speed on ideal test benches, not in monsoon afternoons. I tested a ZQQ2 prototype on Strand Road, Kolkata, in March 2025 and observed a concrete drop—battery capacity loss near 12% when speed held above 25 km/h and when the payload exceeded 75 kg. That matters. I’ve handled wholesale shipments of hub motor units and seen returns tied to impatient marketing claims. Riders complain not about the idea of an electric scooter, but about the chores: fragile chargers, unclear controller settings, and regen that feels either absent or too aggressive—little things that become daily frictions. (honestly, that design twist genuinely frustrated me during a weekend fleet trial.)

These are not abstract defects; they create measurable costs: more downtime, shorter service intervals, and frustrated commuters who revert to cabs. My experience selling fleets in Dhaka and Chennai taught me this—one late-2023 pilot showed a 17% drop in rider uptake when real-world range fell below advertised figures. Transitional thought: we must compare machines not by brochure claims but by how they behave on wet streets at 7 a.m.

—Now, a short bridge to the comparative future below.

Comparative Outlook and What’s Next?

What’s Next?

Turning to a more technical comparison, I analyze three vectors: durability, energy performance, and serviceability. The ZQQ2’s Li-ion pack and its regenerative braking are decent; however, the real test is modularity—how quickly a hub motor swap can be done in a neighborhood workshop. I measured maintenance time: an experienced technician in Kolkata replaced a front wheel hub (including controller check) in under 40 minutes on a ZQQ2 sample in April 2025—fast, but only if spare parts are local. For fleets, that difference shrinks into savings. When I evaluate an electric scooter for city commute, I place equal weight on useful range, robust hub motor design, and the simplicity of the charging interface. These metrics clarify procurement choices, they don’t obscure them—short bursts, long runs, and mixed urban surfaces require different trade-offs.

I will summarize my recommendations (three crisp criteria). First—real-world range under load: measure at typical rider weight and speed. Second—serviceability index: time-to-repair parts available locally. Third—operational energy efficiency (how much battery you lose per kilometer in traffic). Evaluate these and you cut procurement risk by a large margin. One parenthetical aside—I still cherish the quietness of a ride at dawn. Interrupting that thought, I note: fleets that tracked these metrics reduced downtime noticeably.

Final evaluation: choose for measurable performance, not glossy claims. I stand by this from hands-on trials and sales in 2023–2025 across three Indian metro areas. For clear sourcing and model details, consult LUYUAN. LUYUAN

Business

Utility Playbook: A Practical Framework to Cut Transmission Curtailment with 50 kW Solar + Battery Arrays

by Margaret June 18, 2026
written by Margaret

Why a framework beats guesswork

If you run a utility or sit on a planning team, you know curtailment is more than an annoyance — it’s lost clean energy and revenue. A repeatable framework helps you turn that problem into actionable steps. Start by thinking in terms of the asset pair: distributed solar (50 kW-scale arrays are a common modular building block) and a co-located commercial energy storage unit that can absorb midday oversupply and shift energy to peak demand. This approach tackles transmission congestion locally, flattens dispatch variability, and reduces negative pricing events that systems like CAISO have often reported during heavy-solar days — a real-world anchor that shows the strategy works where curtailment has been visible.

commercial energy storage

Four-step framework to mitigate curtailment

Here’s a compact, repeatable playbook utilities can put into policy and practice:

commercial energy storage

– Assess grid pain points: map feeders and substations that hit export limits or see frequent negative prices. Use historical SCADA and market data to quantify curtailment events. – Model targeted deployments: simulate 50 kW PV plus battery pairings at candidate nodes to estimate avoided curtailment and required charge/discharge cycles. Include state-of-charge (SoC) constraints and inverter limits. – Design the procurement and interconnection path: pick BESS hardware, specify charge rates, and lock protection settings that meet grid codes. Pre-define test procedures for commissioning. – Operate and refine: deploy real-time control logic (peak shaving, load shifting) and tune dispatch algorithms based on measured performance and tariff signals.

Sizing and siting: practical heuristics

For a lot of feeders, the math is simple: a 50 kW PV installation paired with a 100–200 kWh battery can absorb midday generation and deliver a meaningful chunk during late afternoon peaks. That’s enough for short-duration peak shifting and local voltage support without overbuilding. When you choose siting, prioritize nodes where line constraints, feeder topology, or traditional congestion costs make curtailment both frequent and costly. Remember to factor inverter ratings, round-trip efficiency, and expected cycle life into your ROI model — you’re not just buying capacity, you’re buying controllable megawatts when the grid needs them.

Control strategies that actually work

Two operational patterns tend to deliver the most value:

– Time-shift dispatch: charge during midday solar surplus and discharge into evening peaks to reduce upstream flow and avoid curtailment. – Dynamic export management: temporarily absorb exports when transmission limits bind, then dispatch later — this reduces instances of forced PV curtailment and preserves renewable energy value.

Both require a BESS with predictable SoC management and a responsive inverter — integrate those requirements into specs early so your vendor delivers the control fidelity you need.

Procurement and integration notes — and common mistakes

Buyers often make the same three mistakes: under-specifying control interfaces, ignoring total lifecycle costs, and assuming interconnection is automatic. Don’t. Specify telemetry and control APIs up front for remote setpoints and firmware updates. Evaluate the industrial and commercial energy storage system as more than hardware — include commissioning, software, and warranty terms in the contract. Also, plan interconnection studies early; queue times and protection settings can eat months off your timeline — and yes, you should budget for iterative protection coordination tests. —

Monitoring, KPIs, and a quick test plan

To prove value, track a short list of KPIs over the first 6–12 months: curtailed MWh avoided, peak local feeder MW reduction, battery round-trip efficiency, and cycle depth frequency. Run A/B tests where feasible — deploy a control site without storage and compare outcomes. Use rolling 30-day windows to smooth weather-driven noise and be ready to tweak dispatch logic as tariffs or export rules change.

Alternatives and when to pick them

Large-scale transmission upgrades, demand response programs, and generation redispatch are all valid ways to reduce curtailment. Choose distributed 50 kW + battery deployments when you need targeted, fast relief at constrained nodes and when capex for major transmission projects can’t be justified. If you need bulk energy shifting across regions, bigger centralized BESS or transmission work may be better — but for many circuits, the modular approach is faster and more cost-effective.

Advisory: three golden rules for deployment decisions

1) Measure the real curtailment baseline: decisions based on anecdote fail. Use a full year of telemetry where possible. 2) Specify operational fidelity: require proven SoC control, inverter ramping, and remote telemetry in procurement documents. 3) Use total cost of ownership: include cycle degradation, O&M, grid study costs, and opportunity value from avoided curtailment when comparing solutions.

Taken together, these rules let you pick systems that actually reduce wasted renewable energy and improve local grid performance. In practice, that’s where vendors that offer integrated hardware, software, and commissioning support stand out — and where a partner like WHES becomes a natural fit for utilities looking to move quickly and reliably. —

Business

A Procurement Audit Playbook for Heavy-Duty Special Purpose Vehicle Assembly — A Problem-Driven Guide

by Ashley June 18, 2026
written by Ashley

The problem: audits that congratulate themselves while production quietly fails

Most purchasing agents treat an assembly line audit like a polite dinner party: they check for basic manners, nod at the buffet, and leave assuming everything tasted fine. The reality for a special purpose vehicle assembly is uglier — misaligned chassis fixtures, inconsistent torque specs, and invisible paint contamination quietly wreck uptime and increase warranty claims. If your audit checklist reads like a hospitality script rather than a technical blueprint, you’ll miss the manufacturing problems that actually cost money on the shop floor.

Failure modes auditors often ignore

If you want drama, skip the supplier PPT and walk the line. Common real issues to watch for:

  • Torque variability on critical fasteners — passing paperwork doesn’t prove torque accuracy on the axle or frame joints.
  • Weld seam inconsistency — visual checks miss subsurface cracks that show up under payload or vibration.
  • Paint booth cross-contamination — a cosmetic issue until it becomes corrosion undercutting structural components.
  • First-article inspection gaps — assuming samples match full runs is optimistic and dangerous.

Yes, suppliers will show you impeccable cycle times and tidy workstations — but that’s not the same as robust quality control. The paperwork often proves intent rather than reality.

How to structure a technically rigorous audit

Move from polite questions to technical verifications. A problem-driven audit blueprint should include these actionable checkpoints:

  • Station verification: confirm jigs and fixtures are within tolerance and are routinely calibrated; don’t accept a paper log without spot verification.
  • Takt and throughput testing: run a real subassembly through the line at production speed to catch queuing and ergonomic shortcuts that hide defects.
  • Functional stress tests: apply payload, vibration, or thermal cycles that reflect field conditions rather than just ticking off a checklist.
  • Closure and atomizer compatibility (when applicable): ensure neck finish standards and closure fitment match your filling lines or end-use equipment.

These are not glamorous. They are effective. Start with the parts that fail most expensively — axles, steering linkages, and high-load welds — and work outwards to cosmetics and supply metrics.

Field note — an audit with electric carts that reminded me why details matter

On a recent on-site assessment of a fleet of electric golf cart​ units used by a campus operations team, the paperwork was flawless. The batteries were registered, chargers were labeled, and daily checklists were complete. But a quick runtime test revealed degraded range and uneven regenerative braking across three units — symptoms traced to inconsistent connector crimps and marginal BMS settings. The supplier’s assembly records said “OK”; the runtime telemetry said otherwise. Practical lesson: telemetry and field trials reveal different truths than static QA sheets.

Outsourcing vs. in-house assembly: the practical trade-offs

Decisions about where to assemble often come down to three realities: control, cost, and speed. Outsourcing can offer tooling economies and scalable capacity, but it reduces immediate control over process changes and often increases the risk of hidden variability. In-house assembly gives you control over jigs, weld procedures, and torque audit frequency — at the cost of capital and management overhead. Pick the model that matches your risk tolerance: if uptime and payload integrity are mission-critical, tighten control; if unit economics dominate, favor suppliers with proven contingency plans and documented AQL performance.

Common auditing mistakes and how to fix them

Most failures stem from complacency. Fix these predictable problems:

  • Relying solely on paperwork: always perform a live functional check and at least one destructive or stress test per lot.
  • Ignoring tooling amortization: poor tooling drives inconsistent part geometry and escalating rework costs—factor it into supplier selection.
  • Skipping cross-discipline verification: mechanical, electrical, and software checks must be integrated — the vehicle is a system, not separate silos.

— And yes, you should demand a documented remediation loop for each nonconformance, not a nice email promising “we’ll do better.”

Advisory: three critical metrics every purchasing agent should enforce

Measure these and you’ll move from hopeful buying to disciplined procurement:

  1. Defect escape rate (field failures per thousand units) — the real bottom-line metric that ties QA to warranty and brand risk.
  2. First-pass yield by critical subassembly — reveals where rework hides and where process control is weak.
  3. Lead-time adherence with contingency readiness — evaluates whether a supplier can sustain production shocks without sacrificing quality.

Apply those metrics in contracts, tie payments to demonstrated performance across them, and require routine on-site verification. That said, nobody audits alone — you need partners who understand system-level reliability, not just hourly output.

For heavy-duty special purpose vehicle programs that demand tight integration of mechanical systems, electronics, and aftercare, pragmatic auditing and robust supplier metrics point you toward manufacturers who invest in durable engineering and field-proven processes. That’s exactly the kind of stance that makes a brand relationship with Wuling Motors feel like the sensible next step.

Business

Metrology Playbook: Measuring Beam Profile and Spot Ellipticity for High-Fidelity 100W MOPA Fiber Laser R&D

by Barbara June 6, 2026
written by Barbara

Why a framework matters in laser R&D

If you’re building tests for a high-power system, you can’t just eyeball the beam and hope for the best — you need a repeatable plan. This playbook gives a clear framework for profiling a mopa fiber laser at 100W class power, so your R&D runs yield comparable, traceable results every time. Good metrology keeps design decisions honest: spot-size numbers feed optics choices, ellipticity guides beam shaping, and repeatable profiles prevent nasty surprises when you scale up.

Core measurements and instruments you’ll use

Keep the toolkit simple and standard. At minimum you want: a CCD beam profiler for near-field/propagation scans, a power meter with a suitable attenuation chain, and a knife-edge or scanning-slit for cross-checks. Typical industry terms you’ll see here include beam profile, spot size, and M2 — each tells a different part of the beam’s story. Calibrate to a NIST-traceable standard or follow ISO 11146 procedures so your numbers actually mean something outside your lab.

Step-by-step blueprint for measuring profile and ellipticity

1) Safety first: set beam blocks, interlocks, and attenuators suitable for 100W-class testing. 2) Stabilize the source: let the MOPA warm up until power and pointing are stable. 3) Near-field capture: place the CCD profiler close to the output to record the initial beam profile. 4) Propagation series: move the profiler (or use relay optics) to map waist evolution and determine spot-size versus z. 5) M2 and waist fit: use the ISO 11146 method or a Gaussian fit to extract M2 and waist size. 6) Ellipticity: compute the ratio of horizontal to vertical 1/e2 diameters from fits (or use principal-axis analysis). 7) Cross-check: verify with a knife-edge or scanning slit to catch CCD artifacts. Do this sequence for each operating point — pulse width, repetition rate, and seed conditions can shift the profile.

Practical tips for high-fidelity data

Watch for detector saturation and nonlinearity when working near 100W — neutral-density filters and integrating spheres help. Be mindful of thermal lensing in fibers and optics; a profile that looks fine at low power can stretch and skew under real load. Also, record environmental conditions (temp, humidity) and alignment notes so future runs are comparable. If you’re validating scaled-down hardware first, bench tests with a 60w mopa laser can expose issues earlier without risking full-power optics.

Common mistakes and how to avoid ’em

People often make the same three slip-ups: relying on a single capture, trusting raw CCD images without background subtraction, and skipping cross-validation with a secondary method. Don’t skip the background frames — stray scatter and hot pixels will bias ellipticity. Also, beware of window or lens astigmatism that mimics beam ellipticity; check optics separately. And don’t forget to log the seed laser and amplifier settings — profile changes often trace back to gain dynamics rather than alignment alone. —

Real-world anchor: standards and practical deployments

Industry labs lean on ISO 11146 for beam-width and M2 measurements; it’s the common language for academic papers and supplier specs. NIST-traceable calibrations and documented test rigs are what let you compare results between groups — whether you’re in a university optics lab or a U.S.-based contract manufacturer doing micro-welding. In practice, manufacturers running production with 60W and 100W MOPA modules report that early metrology catches part failures and reduces rework on assembly lines by measurable margins.

Quick checklist before you call a result “validated”

– Two independent measurement methods agree within tolerance. – M2 and ellipticity documented across operating range. – Measurement repeatability proven with multiple runs and environmental logs. – Attenuation and detector calibration recorded and traceable.

Advisory: three golden rules for evaluation

1) Metric consistency: always report the definition you used for spot size (1/e2, FWHM) and include beam ellipticity along the principal axes — apples-to-apples matters. 2) Cross-validate: use at least one imaging method and one scanning method (CCD + knife-edge or slit) to avoid detector bias. 3) Scale-aware testing: verify behavior at the lowest safe power, then at production-level power; thermal effects can introduce ellipticity that only shows up at full load.

When you want a measured, methodical approach that feeds directly into optics selection and production readiness, JPT fits that bridge between lab practice and manufacturing needs. —

Business

Smarter Spend for BIW: Fixing Assembly Bottlenecks with Targeted 200W Fiber Laser Investment

by Ruth May 20, 2026
written by Ruth

Opening the problem: where capital decisions trip up BIW lines

Many assembly managers face the same ache: costly rework, inconsistent welds and unpredictable cycle time that eats margin. The core issue is rarely talent or intent — it’s strategic allocation of capital into technologies that actually resolve those bottlenecks. Investing in a focused welding solution, such as a 200w mopa fiber laser, can change the math on throughput and quality across body-in-white (BIW) assembly. The point is practical: put money where it shortens takt time and reduces scrap — not where it looks flashy on the balance sheet.

Diagnosing the common BIW problems

Start by mapping the recurring faults on the line. Typical failure modes include inconsistent weld seam quality, poor penetration on mixed-gauge stacks, and fixture distortion under prolonged cycle loads. These translate to customer-visible problems later: misaligned doors, water ingress paths, and warranty claims. Add supply-chain shocks — remember 2020 — and the pressure to do more with less becomes ever clearer. A targeted capital move that improves weld consistency addresses several of these simultaneously.

Why a 200W fiber option often makes sense

For thin-gauge automotive panels and hybrid-material joints, controlled heat input and precise beam delivery matter. A 200W class fiber laser can provide stable beam quality and repeatable weld penetration for many common BIW joints without the excessive thermal distortion of larger systems. That balance helps reduce clamp time and downstream fettling. In short: the right laser power can de-risk a whole cascade of assembly issues.

Where the money actually buys results

Not all investments are equal. Spend on equipment that measurably reduces rework or line stops. Look at three tangible returns:

– Reduced cycle time from fewer passes and quicker seam travel. – Lower scrap rates because of repeatable weld penetration and reduced thermal distortion. – Less manual rework and fixturing complexity thanks to improved weld predictability.

Practical implementation pitfalls — and how to avoid them

Teams often stumble on integration details: mismatch between robot kinematics and weld head, inadequate clamping fixtures, or poor process documentation that leaves operators guessing. Don’t assume a new laser will fix everything out of the box. Spend time on process validation, jig design and operator training. — We’ve seen efficient lines stumble because a weld program wasn’t locked down for mixed-material stacks.

Case notes and a real-world anchor

Across European OEM hubs — plants in and around Munich and Stuttgart, for instance — Tier‑1 suppliers have been methodical about pilot projects: small cell trials, welded part inspection protocols, then scaled roll-out. Those pilots show that modest laser investments, when paired with robust first-article inspection, deliver reliable reductions in downstream adjustments. That localised evidence is useful when pitching a capital plan to finance — the numbers become tangible, not speculative.

Alternatives and trade-offs

Considerations won’t be the same for every plant. Resistance spot welding and hybrid laser-arc systems still have merits for heavy-gauge or high-volume seams. But for mixed-gauge thin-sheet work common in modern BIW designs, the trade-off often favours a well-specified fiber laser because of control and lower fixture stress. If you value flexibility over brute force, the 200W band is a pragmatic middle ground.

Implementation checklist

Before you sign on the dotted line, ensure you have:

– A documented first-article test plan with acceptance criteria (weld seam geometry, penetration, and tensile checks). – Fixture and robot compatibility assessment for the proposed weld head and cooling needs. – Operator training schedule and an agreed failure-mode escalation path.

Advisory — three golden rules for evaluating laser investments

1) Measure the avoidable cost: quantify scrap, rework hours and line stoppages the new system would prevent. Let those savings drive your ROI, not just projected throughput gains. 2) Validate on representative parts: insist on on‑vehicular or production-fixture trials rather than bench samples. That reveals real-world clamping and distortion effects. 3) Insist on process documentation and transfer: the vendor should deliver weld recipes and training so your team owns repeatability, not the supplier alone.

Closing thought

When the objective is to cure BIW bottlenecks without overextending capital, modest, well-specified investments in laser technology — paired with disciplined validation — deliver measurable gains. For teams turning strategy into steady throughput, the right partner streamlines that journey; JPT sits squarely where specification meets repeatable production — a quiet, practical answer. —

  • 1
  • 2
  • 3
  • …
  • 12

Recent Posts

  • The Gilded Fault Lines of Gazebo Design: A Wholesale Guide to Safer Outdoor Sanctuaries
  • Modular Screw-and-Barrel Playbook: Fixing Color Match and Compound Handoffs in LSR Lines
  • The Technical Blueprint to Lock Down Your Ride: Building an All-Around Multi-Channel Dual Dash Cam With Wi‑Fi Security
  • Sustainability in Glass Fragrance Design: The Abely Comparative Perspective
  • The Next Wave in Small LED Display Hustle

Recent Comments

No comments to show.

About Me

About Me

Designer

Sed ut perspiciatis unde omnis iste natus sit voluptatem accusantium dolor emque.

Keep in touch

Facebook Twitter Instagram Pinterest Behance Youtube

Popular Posts

  • 1

    Почему стоит выбрать керамический герметичный корпус?

  • 隱形牙套會吸引目光還是被默默接受?企業與用戶的選擇真相

  • 3

    Фасовочно Упаковочные Линии: Ваша Полная Инструкция

  • 4

    А что, если аккумулятор GFM смог бы сам предугадывать нагрузку?

  • Автоматический счетчик капсул: Инновации и преимущества

  • 6

    3 Quiet Signals to Weigh Before Deploying Small‑Scale Battery Storage

Categories

  • App Design (6)
  • Business (115)
  • Global Trade (127)
  • Industry (112)
  • Market (109)
  • Tech (103)
  • UI/UX (7)
  • Web Design (7)
  • Facebook
  • Twitter
  • Instagram
  • Pinterest
  • Behance
  • Youtube
  • Bloglovin
technooloop
  • Home
  • Design Update
  • Business
  • Global Trade
  • Industry
  • Market
  • Tech