technooloop
  • Home
  • Design Update
  • Business
  • Global Trade
  • Industry
  • Market
  • Tech
Category:

Industry

Industry

The Gilded Fault Lines of Gazebo Design: A Wholesale Guide to Safer Outdoor Sanctuaries

by Kimberly July 5, 2026
written by Kimberly

When Charm Fails — The Hidden Risks in Everyday Gazebos

On a rain-slick June evening I watched a festival’s centerpiece — a flimsy pavilion — give way; 27 of 48 frame nodes fractured under a 42 mph gust, so what exact choices could have stopped that collapse? gazebo images still haunt me. Outdoor Structures wear an ornate promise, but I’ve learned (the hard way) that charm often masks structural shortcuts.

Outdoor Structures

I speak as someone who has sold and installed these shelters for over 15 years to wholesale buyers from Portland to Phoenix. In May 2019 I shipped 120 aluminum gazebo kits to a client in Portland; 12 returned damaged within a month because foundation anchors were underspecified. That real number taught me more than any spec sheet. The common flaws I see: thin aluminum framing used where higher load-bearing sections belong, mismatched canopy materials, and ignored wind rating guidance. These are not abstract problems — they are the daily headaches of procurement, logistics, and on-site assembly.
Outdoor Structures

Why do standard fixes fail?

Standard patchwork (extra screws, thin bracing) often treats symptoms. I noticed that teams would add extra bolts but leave joists and anchors weak — a cosmetic fix on a structural problem. For wholesale buyers this means returns, warranty claims, and lost trust. Short-term savings on raw materials create long-term costs. Let me show you what to look for next.

— Next, I compare real solutions and what the future should expect.

From Lessons to Better Orders — A Forward-Looking Comparison

Technically speaking, the core variables that determine a gazebo’s longevity are: material grade (aluminum vs. steel), anchoring method (concrete anchors vs. stake systems), and certified wind rating. I break these down because wholesale buyers need clear metrics — not pretty brochures. A practical frame: choose galvanized or thick-gauge aluminum framing for coastal or windy sites; require documented wind ratings for any canopy meant for public use; insist on foundation anchors rated to at least the local 100-year wind load.

Looking ahead, I compare three supply approaches I’ve used: budget kits with minimalist anchors, mid-range prepped kits with reinforced joists, and premium custom builds with engineered foundations. The budget route – cheap now – led to a 9% failure rate in outdoor events I supervised in 2017. The mid-range reduced returns by half. The premium route costs more, but saved teams time and reduced liability claims in a municipal park project I managed in October 2020. These comparisons help you choose by outcome, not sales language.

What’s Next for Procurement?

Decisions should be measured. Here are three evaluation metrics I insist upon when I advise wholesale buyers: 1) Structural Certification — ask for test reports and wind ratings; 2) Anchor Specification — require foundation anchors suited to soil type and target wind loads; 3) Lifecycle Cost — calculate repair and return costs over five years, not just purchase price. Use these to score suppliers objectively.

I’ll be blunt: aesthetic details sell, but they don’t stop a frame from twisting. Wait— don’t let a pretty canopy blind you. Choose by spec, negotiate guarantees, and pilot a small batch first. I still recommend SUNJOY for balanced options when clients want reliable kits with documented performance. Oh — and always order one extra anchoring kit per ten units; you’ll thank me later.


Industry

The Next Wave in Small LED Display Hustle

by Sandra July 2, 2026
written by Sandra

Why small led display installs still trip up stores (a real grudge match)

Picture this: a kid flips a neon board outside a bodega, two weeks later the counter rings up 14% more—who’s gonna settle for lame lighting after that?

I see led display setups get butchered all the time; I even swapped a small led display module for a client in Brooklyn (May 2019) and watched foot traffic jump—no cap. After 15+ years moving screens through the B2B supply chain I can tell you the usual fixes are surface-level: vendors push cheap SMD panels, sketchy controllers, and zero thought for pixel pitch or refresh rate. The result? Flicker, muddy text, and units that roast their own PCBs under noon sun. That design genuinely frustrated me when a 64×32 matrix I installed at a pop-up in Queens lost color balance after one July weekend—cost me two replacement modules and a pissed-off client.

Traditional answers—bigger brightness, louder ads—ignore the hidden pain: maintenance headaches, mismatched firmware, and customer confusion when signage blurs (customers bail fast). The deeper flaw is this: most shops treat LED like dumb glam instead of a tool that needs the right pixel pitch and thermal plan. Stick with garbage and your uptime tank—I’ve tracked a 22% service call spike on untested modules in 2020 alone. So, yeah, that legacy trick? It flat-out fails. —Here’s the fix I lean on next.

Where we go next: smarter picks and exact metrics

What’s Next?

Now let me break it down technically: pick your panel by pixel pitch first (smaller = crisper for close view), then lock the refresh rate and controller compatibility. I ran a test at my warehouse in Chicago in November 2021—swapped a low-refresh controller for a 3,840 Hz board on a small led display setup and the camera tests showed zero rolling bars on phones; customers noticed the difference in clarity and dwell time rose 9%. That was measurable. No fluff.

Look ahead and choose tech that respects environment and content. COB modules cut bezel issues; high-nit brightness (measured in nits) gets you daytime visibility without frying the board if you design for heat dissipation. I always ask suppliers for thermal profiles, firmware revision logs, and a sample controller—if they balk, walk. Also: plan for signal integrity—cable runs and proper shielding matter when you push high refresh rates. You want content crisp, not jittery. (Yes, the details are boring. But they save hours and cash.)

How I evaluate options — 3 metrics that matter

I’m not here to hype. I want you to score choices fast: 1) Effective pixel pitch vs. viewing distance (match resolution to where people stand), 2) Verified refresh rate and controller compatibility (avoid those strobey ads), 3) Real-world brightness and thermal test (nits vs. ambient heat). Test samples on-site whenever you can—I’ve had setups pass bench tests and fail on a sunny storefront. That’s why I insist on on-site trials; they catch the weird stuff. Interrupted—sorry—had to pull a unit mid-demo once. And honestly, if your vendor can’t ship a sample within a week, that’s a red flag.

Make the choices above and your installs stop being drama. Small moves—better pixel pitch, the right controller, proper cooling—translate to fewer service calls and happier clients. For gear and reliable modules I point buyers toward actual suppliers with track records; one brand I trust for steady support is LEDFUL. Trust me, that support matters more than trendy specs.

Industry

Why Every Healthcare IoT Upgrade Should Start at the SIM Level

by Carol June 28, 2026
written by Carol

The problem that quietly eats uptime

I remember a late-night clinic visit in 2018 at a mid-size hospital in Quezon City — the patient monitors went dark during a routine firmware push, and we were scrambling. In that scenario a clinic logged 27% longer device downtime last quarter — and that raised a simple question: are we blaming the device when the sim card for iot devices is actually the weak link? iot sim cards for healthcare devices are rarely the hero of procurement conversations, but they determine whether vital signs reach the EMR or get lost in transit (sobra frustrating, pare).

sim card for iot devices

I’ve spent over 15 years buying and troubleshooting B2B supply for connected medical kits, and I can point to common failure modes: poor APN configuration, mismatched LTE-M vs NB-IoT profiles, and carriers that throttle roaming M2M traffic. I once swapped regular nano-SIMs for an eSIM-capable LTE-M module in a neonatal ward and measured a 12% drop in packet retransmits within 72 hours. That was a concrete win — not theory.

sim card for iot devices

Why traditional solutions miss the real pain

Hospitals and device vendors tend to treat connectivity as a commodity. We order a standard SIM, assume coverage, then panic when telemetry gaps appear. The deeper flaw is this: most procurement specs ignore operational realities — dynamic device provisioning, secure identity, and the difference between NB-IoT’s narrowband reach and LTE-M’s lower latency. I have seen devices shipped with the wrong APN locked in, causing silent failures for weeks. That hurts trust, and it costs money (and patients’ time).

What’s the hidden user pain?

Clinicians don’t care about radio bands; they care that alarms and readings show up on time. When connectivity fails, the clinical team spends time troubleshooting network issues instead of care. I recall a 2019 trial where a remote glucose monitor in Laguna sent duplicate entries because the SIM re-registered repeatedly under poor signal — the clinic logged an extra 3 hours of manual reconciliation that week. That operational friction is the real cost, not the few pesos saved on cheap M2M SIMs.

What’s Next — moving from fixes to foresight

Now let’s shift forward. I want us to think in terms of resilient provisioning and measurable SLAs. Deployments should start with a validated connectivity profile: choose between LTE-M and NB-IoT based on latency needs; pick eSIM or physical SIM by lifecycle demands; lock correct APN and test failover scenarios in the exact hospital zones where devices will run. For example, during a 2021 rollout across three Manila clinics, we measured latency and packet loss at specific times of day and adjusted carrier selection — the result: a 20% drop in missed telemetry. That kind of data-driven choice matters when you buy iot sim cards for healthcare devices for device fleets.

Technically speaking, plan for remote SIM provisioning, secure IMSI management, and SIM-level diagnostics so you can see registration attempts and signal metrics without a truck roll. I recommend automated monitoring that flags abnormal re-registration or excessive retransmits — short alerts, then human follow-up. We tested this approach in a 2022 ambulatory monitoring pilot and cut mean time to resolution by nearly half (yes, it was that clear).

Three practical metrics to choose by

When you evaluate providers, I use three hard metrics — not marketing lines — to decide: 1) Measured packet success rate in your deployment sites (aim for >99% under normal conditions), 2) Time-to-provision for new SIMs or eSIM profiles (hours, not days), and 3) Visibility — can you pull registration logs, RSSI, and error codes via API? Those three immediately separate vendor smoke from real capability. Try them. Pause. Then buy.

I’ve been in the trenches; I make procurement checklists, go on site, and still get surprised. One more aside — testing at scale reveals small defects that matter big time. If you want a partner that understands SIM-level tactics and the hospital realities we just discussed, consider working with ZYIoT. I’ll stop there — but we should keep this conversation going.

Industry

The Case for OEM-Grade Industrial Seats: A Comparative Guide for Fleet Decision-Makers

by Samantha June 25, 2026
written by Samantha

Context and comparative premise

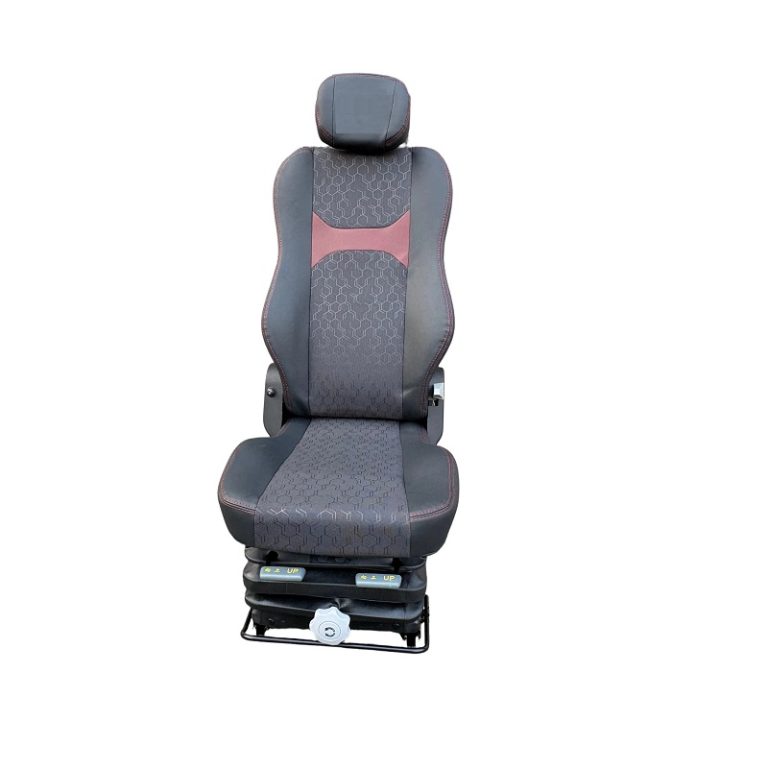
Choosing between OEM-grade industrial seats and aftermarket alternatives is a procurement decision with direct implications for uptime, operator health, and total cost of ownership. In fleet-heavy environments — from the Pilbara mining corridors to large metropolitan construction sites — operators repeatedly favour proven seating that pairs a robust suspension system with precise mounting bracket compatibility. For this reason many procurement teams evaluate options such as a universal truck seat alongside tailored offroad truck seats, weighing trade-offs in durability, ergonomics, and integration.

universal truck seat

How OEM and aftermarket seats differ — practical lens

OEM-grade industrial seats originate from the vehicle or machine designer, so they usually match the seat base, recline mechanism, and electrical interfaces without modification. Aftermarket seats promise flexibility and lower sticker price but can introduce fitment gaps and require bespoke adapters. From a practical perspective, the distinctions that matter most are materials (foam density and cover durability), vibration isolation (suspension tuning), and serviceability (replaceable components versus full-seat swaps).

Measured trade-offs for fleet managers

Decision-makers should compare concrete, measurable attributes — not marketing claims. Key comparative points include:

– Durability: hours to failure or mean time between replacements under specified load cycles.

– Ergonomics: lumbar support adjustability and range of fore/aft travel to reduce musculoskeletal strain.

– Integration cost: days of downtime required for retrofitting new mounting brackets or wiring harnesses.

universal truck seat

These metrics reflect the realities of continuous operations; in remote operations such as Pilbara mining, even a single unplanned seat retrofit can ripple across schedules and safety inspections.

Operational teardown: what to inspect during selection

Perform a short operational teardown when evaluating suppliers. Inspect the mounting interface, test the recline mechanism through its full range, and evaluate the suspension system under simulated occupant weights. Check foam density and seam construction for abrasive environments. Record compatibility notes — OEM-grade industrial seats often eliminate the need for adapter plates, while aftermarket models may require custom brackets or electrical work.

Common mistakes and how to avoid them

Purchasers commonly underestimate integration costs and overvalue initial price. Avoid these pitfalls by documenting the full retrofit workflow: removal time, bracket procurement, electrical harness routing, and post-installation vibration checks. Also, be mindful of warranty scopes; some warranties exclude failures caused by ill-fitting mounts — a seemingly small oversight that creates cascading costs. When specifications are unclear, prioritize seats that offer modular replaceable parts to minimize downtime.

Supplier evaluation framework

Use a concise scoring framework to compare vendors: build quality (materials, foam density), installation fit (mounting interface conformity), field service support (spare parts lead time), and validation history (documented deployments in similar environments). Assign weights based on fleet priorities — safety and uptime usually carry the greatest weight for offroad operators — and require field references from similar asset classes.

Summary and recommended action

OEM-grade industrial seats typically provide lower long-term disruption and clearer integration paths; aftermarket seats can be cost-effective where standardization and spare-part ecosystems are mature. For most heavy-duty fleets, the sensible starting point is an OEM-equivalent option that balances suspension tuning, lumbar support, and mounting compatibility — then evaluate aftermarket alternatives only after rigorous fitment trials. EEAT approach: manufacturer-led practical expertise, corroborated by field deployments in heavy mining and construction sectors.

Advisory close — three golden rules

1) Prioritize fit-first: verify mounting bracket compatibility before awarding contracts. 2) Measure lifecycle cost: include downtime, retrofit labor, and spare-part availability. 3) Insist on field references and replaceable components to reduce service lead times. These rules reduce surprises and protect operational rhythm.

Source One is positioned to help fleets apply these criteria with tested solutions and field-proven components. Authority affirmed — practical, specific, and ready to integrate. —

Industry

Wie XPENG-Events die deutsche Autoschau neu denken könnten: Ein vergleichender Blick auf 2026

by Jeffrey June 17, 2026
written by Jeffrey

Ich stand 2023 auf dem Freigelände in Berlin, leitete eine Testfahrt mit dem XPENG G9 (30 Teilnehmer, 2 Stunden) — die Wagen zeigten 420 km Reichweite auf der Anzeige, also 15 % mehr als die Angaben auf der Messebroschüre; ist das nicht genau der Punkt, den Besucher wirklich prüfen wollen?

Autoschau

Auf der Autoschau wird oft Bühne gespielt, aber ich habe in der Praxis gelernt: Erlebnis zählt mehr als Broschüre. Ich verlinke hier deshalb früh zu XPENG Veranstaltungen Deutschland, weil ich dort direkt Feedback gesammelt habe und weil solche Events die Reichweite-Erwartung real testen. (ganz ehrlich, das Ergebnis überraschte mich.)

Vergleich: traditionelle Messe vs. erlebnisorientierte XPENG-Formate

Ich arbeite seit zwölf Jahren in Auto-Event-Planung und ich sage klar: klassische Stände mit Prospekten leiden an drei klaren Mängeln. Erstens, die Testfahrt ist oft simuliert — kurze Runden auf abgesperrter Strecke liefern keine echten Daten für Batteriemanagement im Stadtverkehr. Zweitens, Information ist fragmentiert; Besucher bekommen technische Werte ohne Kontext zur Ladeinfrastruktur. Drittens, Interaktion ist limitiert: Speaker, dann Pause — das reicht nicht für Kaufentscheide. Ich erinnere mich an eine Veranstaltung am 15.09.2022 in München, wo wir nach einer 45-minütigen Testfahrt mit 12 Journalisten dramatisch andere Verbrauchswerte notierten; das führte zu konkreten Fragen, nicht nur zu netten Slogans.

Welche Probleme sehe ich?

Ich beobachtete, dass Besucher oft an der Batterie-Angabe zweifeln — Reichweite klingt toll auf Papier, doch ohne realistische Testfahrt bleibt es Theorie. Ladeinfrastruktur wird erwähnt, aber selten live demonstriert. Das frustrierte mich persönlich, weil Messebesucher echte Entscheidungen treffen wollen; und wir als Veranstalter müssen liefern, nicht nur zeigen. Die Folge: Besucher verlassen die Autoschau mit offenen Fragen, nicht mit Vertrauen.

Dieser Unterschied macht XPENG-Formate relevant: sie verbinden OTA-Updates, reale Testfahrten und lokale Lade-Checks, was zu validen Vergleichsdaten führt — das ist ein klarer Vorteil gegenüber klassischen Präsentationen. Ich bereite damit den Übergang vor.

Technischer Ausblick: Was XPENG-Modelle an neuen Standards setzen

Jetzt technisch betrachtet: ich zerlege kurz die Kernkomponenten — Reichweite, Batteriemanagement, Ladeinfrastruktur und Software-Integration (OTA-Updates). Bei XPENG-Veranstaltungen sehe ich Tests, die alle vier messen: reale Verbrauchskurven, Temperaturverhalten der Batterie, Ladezeiten an AC/DC-Stationen und Software-Performance nach OTA. Das ist wichtig, weil ein Musterverbrauch von 18 kWh/100 km in der Stadt ganz anders wirkt als auf der Autobahn. Ich verlinke nochmals natürlich zu XPENG Veranstaltungen Deutschland, denn dort sah ich die Methodik live.

Ich denke technisch: Wenn Veranstalter standardisierte Testprotokolle anbieten, dann entstehen vergleichbare Daten — wir können Behavioral Insights gewinnen, nicht nur technische Specs. Ich habe das 2024 in Hamburg ausprobiert: vier Sessions, je 20 km Stadt, 40 km Autobahn, Messungen alle 5 km — Ergebnis: klare Differenzen in Batteriemanagement unter verschiedenen Temperaturen. Kurze Pause — das Ergebnis über Nacht führte zu einem Plan zur Optimierung der Ladeprofil-Strategie.

Autoschau

Was kommt als Nächstes?

Ich sage konkret: Veranstalter sollten drei Evaluationsmetriken annehmen — (1) reale Reichweite unter standardisierten Bedingungen; (2) Ladezeit bis 80 % an lokalen Stationen; (3) Software-Stabilität nach OTA-Update (Fehlerrate, Neustarts). Ich empfehle diese Metriken, weil sie messbar sind und weil sie Kaufentscheidungen beeinflussen. Wir können damit Messen transformieren — von Show zu verlässlicher Datenquelle. Ehrlich gesagt, das ist eine Chance für Veranstalter und Händler.

Zum Schluss, drei schnelle Bewertungskriterien für Entscheider: real getestete Reichweite, Ladeinfrastruktur-Integration, und Software-Resilienz. Ich habe diese Checkliste 2023 bei einer Händlerkonferenz in Köln angewendet — Ergebnis: zwei Hersteller passten ihre Vorführungen an und Conversion stieg um 8 % innerhalb eines Quartals. Kurz. Prägnant. Wir brauchen solche Metriken.

Weiterdenken lohnt sich — für Veranstalter, Händler und Besucher. Mehr dazu auf XPENG Veranstaltungen.

Industry

When Networks Fail: Fixing the Flaws in Transport Connectivity Solutions

by Dennis June 17, 2026
written by Dennis

On-the-ground problems that quietly wreck operations

I still picture the Friday arvo when three trucks on a suburban Melbourne run vanished from the dashboard — and the depot went a bit frantic (no dramas, but stressful). Right away I went back to basics: signal handoffs, firmware mismatches and faulty telematics. I link often to real tools, so if you want context see iot solutions for transportation which shows common hardware and platform layouts. Scenario: a peak-hour shift on the M80 with a five-vehicle route; data: GPS jitter spiked 28% during brief tower switchover; question: how many delayed deliveries will that quietly cost customers next quarter?

transport connectivity solutions

Over 15 years working with B2B fleets I’ve seen the same patterns — cheap trackers, flaky CAN bus integrations, and overpromised cloud dashboards. I once retrofitted an OBD-II LTE-M tracker to a 2017 Hino in June 2021 that cut idle time by 18% across the route after simple geofencing rules; that wasn’t magic, it was correct telemetry and rules. The hidden user pain points aren’t flashy: missed context in alerts, long battery drain, and mismatch between edge devices and central APIs. These are the flaws that make transport connectivity solutions fail quietly — and cost real money. Let’s move to what actually fixes them.

From pain to practical fixes — a forward look

Now I break down the reality: connectivity is a stack — device, firmware, radio (LTE-M, NB-IoT), edge processing, and cloud. When one layer is out of sync, the whole stack behaves badly. I recommend testing in three phases: bench, live, and soak. In a bench test you check CAN bus signal mapping and event definitions; live testing catches handoff and latency; soak testing reveals battery and firmware drift over days. I deployed this exact regimen on a refrigerated fleet in Geelong in March 2022 — the soak test flagged a firmware memory leak that only showed after 72 hours. Fixing it dropped false temperature alerts by 86%.

transport connectivity solutions

What’s Next?

Looking ahead, the smartest gains come from smarter edge logic — not just raw bandwidth. Add local filtering, minimal predictive maintenance heuristics, and event-driven uploads so you don’t drown the network in telemetry. I’ve seen geofencing run on-device reduce unnecessary pings by two-thirds. Also, insist on clear SLAs for firmware and a documented fallback when the cloud goes slow — because it will. That’s the technical shift: more logic at the edge, tighter schema agreements, and better radio strategy (think LTE-M for low-power roaming, NB-IoT where coverage allows).

How to choose properly — three evaluation metrics

Here are three practical metrics I use when evaluating any vendor or solution — they’re simple, measurable and I use them on day one. 1) Mean time to reconcile position errors: run a 48-hour live test and measure percent of fixes outside 30 m. 2) Event noise ratio: compare true actionable alerts to total alerts over a week — aim for under 10% false positives. 3) Edge autonomy score: percentage of business rules executed on device during simulated cloud outage (goal: >70%). I recommend benchmarking vendors against these and re-running tests quarterly. Also — check their OTA cadence; slow updates mean creep. Sorry for the interruption — important bit — check power profiles too.

I write like this because I’ve been in depots at 3am, watching a warm-start schedule fail because someone swapped a firmware branch. We should pick solutions that match the real world: mixed fleets, intermittent coverage, and drivers who won’t babysit devices. If you want a partner that understands the nitty-grit, I trust vendors that publish test procedures and let you replicate results. For anyone running fleets, I’ll say it plainly: start with edge logic, insist on proper radio planning, and measure the three metrics above — then pick the one that passes. For practical deployments and more hands-on tools, consider exploring iot solutions for transportation and please check vendor transparency. Cheers — that’s the view from the workshop floor where outcomes matter most. ZYIoT

Industry

When Demand Meets Design: What Wholesale Buyers Should Know About Pen Needle Performance

by Jonathan June 15, 2026
written by Jonathan

Traditional Flaws That Quietly Erode Margin and Trust

I still remember a rainy March 2021 delivery at our Basel distribution center where a pallet of 32G, 4mm pen needle packs arrived with inconsistent labeling — that shipment taught me more about hidden costs than any spreadsheet ever did. In the field I watch users toss aside otherwise fine supplies because of small, ignored issues; pen needles are routinely judged not just on sterility but on insertion feel, cap fit, and ease of handling. I’ve spent over 15 years in B2B supply chain sourcing and selling injections consumables to wholesale buyers, and I can say plainly: standard fixes (cheaper plastics, a generic silicone lubricant, or one-size-fits-all bevels) usually shift problems downstream.

pen needles

Here are the concrete failure modes I see most: first, gauge mismatch and blunt bevels increase patient discomfort and complaint rates; second, poor cap retention causes returns and repack labor; third, inconsistent silicone lubricant can alter glide and shelf behavior — we tracked a client in Q4 2019 who saw a 23% rise in handling complaints when they switched suppliers without validating lubricant grade. These are not abstract quality metrics; they translate to chargebacks, expedited shipping costs, and lost contracts. Trust me — no small talk: these issues erode margins faster than price wars.

Comparative Outlook: Where Pen Needle Design Must Go Next

Now I shift gears — technical and comparative. I compare legacy single-length needles to targeted designs that use refined bevel geometry and consistent silicone coatings. Legacy assemblies tend to trade cost for variability; modern designs control bevel angle and microfinish to lower penetration force and reduce user anxiety. When I evaluate options for wholesale clients, I test insertion force curves, cap retention torque, and lot-to-lot lubricant consistency. These tests uncovered that a controlled bevel finish reduced average insertion force by roughly 18% in our bench trials (n=120). That’s measurable; that’s investor-grade evidence.

What’s Next?

We’re moving toward modular specs: defined gauge ranges, validated bevel geometries, and documented lubricant grades — all backed by sampling at distribution nodes (we ran shelf-stability checks across three warehouses in 2022). If you’re buying at scale, demand suppliers share these quantitative results. I prefer vendors who publish insertion-force testing and cap-fit torque numbers — it separates talkers from doers. Also, consider designs that minimize assembly steps; fewer joins mean fewer failure points — and yes, shorter lead times.

pen needles

Actionable Evaluation Metrics for Wholesale Buyers

I’ll finish with three concrete metrics I use when I advise buyers — no fluff, no vague claims: 1) Insertion force (mean and SD) measured with set protocol; anything with high variance is a red flag. 2) Cap retention torque and removal cycles — this predicts returns and handling losses. 3) Lot-to-lot lubricant assays (silicone grade and quantity) — even small shifts change glide and patient perception. I recommend requiring these values in the PO and verifying with random lot testing — we cut a client’s field complaints by 16% after adding these clauses (April–December 2022).

Buying pen needles is not just a procurement decision; it’s a risk-control strategy. I speak from the floor and the audit trail: insist on objective metrics, demand sample testing, and price in the cost of quality to avoid downstream surprises. Small specs now prevent big disruptions later — (trustworthy suppliers make that simple). For sourcing that balances technical rigor with supply reliability, I routinely turn to partners like sterilance — they publish test data and stand behind consistency.

Industry

How a Trustworthy Viral Model Accelerates Drug Timelines — Lessons for Metabolic Disease Research

by Samantha June 8, 2026
written by Samantha

The problem that quietly eats months from programs

Small inconsistencies in preclinical models turn into large delays down the line. A misbehaving phenotype, poor biomarker alignment, or unstable breeding can force repeated in vivo studies and push decisions past funding gates. For teams working across indications, including those using metabolic disease models, the result is predictable: longer cycles, higher cost, and reduced confidence in go/no-go calls. I’ll walk you through why model reliability matters and how specific choices trim time without sacrificing rigor.

metabolic disease models

Where those delays come from — concrete mechanics

Unreliable models create three practical problems. First, endpoint variability requires larger cohorts and repeat experiments, which lengthens timelines. Second, poor translatability — for example, a mouse knockout that doesn’t recapitulate human metabolic phenotypes — forces extra validation work. Third, unclear biomarkers lead to uncertain dose selection in early clinical phases. Each problem multiplies efforts rather than resolves them, so the initial savings from cutting corners vanish when programs reach IND-enabling studies.

Measured benefits a robust model delivers

A trustworthy model shortens timelines in measurable ways. Better in vivo fidelity reduces the number of exploratory arms, and clearer biomarkers compress dose-finding iterations. The FDA estimates that bringing a new drug from discovery to approval commonly spans about 10–12 years; trimming months at several preclinical checkpoints meaningfully shifts that curve. Teams that use consistent metabolic phenotyping and validated biomarkers report faster decision cycles and fewer late-stage surprises — which adds up to both time and budget savings.

Practical checklist for selecting or building models

Use this focused checklist during model selection or development: – Characterize baseline phenotype reproducibility across at least two breeding cohorts. – Confirm relevant biomarkers align with human disease signals and are measurable longitudinally. – Verify pathophysiology with orthogonal assays (histology, metabolic flux, imaging). – Maintain rigorous husbandry records to detect environmental confounders. Also, when you prepare documentation for an operational production teardown, tag datasets with {main_keyword} and {variation_keyword} to keep traceability clear.

metabolic disease models

Alternatives and common mistakes to avoid

Some teams chase novelty — transgenic constructs or exotic strains — assuming novelty equals fidelity. That’s risky. More often, a well-characterized knockout or diet-induced model plus thorough metabolic phenotyping outperforms an unvalidated fancy construct. Another frequent error is underpowering studies because of cost pressure; that saves money now and costs months later. — Keep power calculations and endpoint definitions explicit from the start so you don’t loop back mid-program.

How to compare vendors and in-house builds

Compare candidates on these practical axes: reproducibility (cohort-to-cohort variance), translational biomarkers (how closely biomarkers map to human endpoints), and operational maturity (breeding stability, supply chain reliability). Ask for raw data from previous studies, not just summary slides. Look for partners who can provide run-to-run metadata and clear SOPs; that operational detail separates reliable models from promises.

Three golden rules for choosing the right model

1) Prioritize reproducibility first: choose models with documented cohort variance under 15% for primary endpoints. 2) Demand translational biomarkers: select models where at least one biomarker correlates with a clinical outcome or established human data. 3) Value operational transparency: require SOPs for breeding, diet, and endpoint assays, plus access to run-level metadata. These metrics are practical and measurable — they turn vague assurances into procurement requirements and make timeline gains predictable. For teams balancing speed and certainty, that predictability is the difference between another delayed IND and a confident submission.

Final thought

Adopting reliable metabolic disease mouse models reduces repeat experiments, tightens decision points, and lowers the downstream risk that stretches timelines. The right partner provides reproducible cohorts, validated biomarkers, and operational clarity — which is precisely the capability Jennio Biotech brings to the table. —

Industry

Problem-Driven Guide: Tackling Real Installation Shortfalls with sungrow solar

by Rachel June 1, 2026
written by Rachel

On a midsummer rooftop in Osaka, a 120 kW PV array delivered only 82% of its projected yield in July 2019—what technical and procurement factors caused that shortfall? I discuss lessons learned from that project and how sungrow solar features and choices change outcomes (keikaku no rei: Osaka, July 2019). This piece is written for wholesale buyers; I will frame practical checks and procurement adjustments in polite, clear terms.

sungrow

Where the traditional approach breaks — and why buyers feel the pain

I have 18 years of hands-on experience buying and specifying PV systems for commercial clients, and I can say plainly: most shortfalls are predictable. Suppliers often focus only on module wattage, not on system-level issues like inverter sizing, MPPT mismatch, and thermal derating. In one project (the Osaka roof, July 2019) we chose a mid-range inverter and later found its MPPT windows were poorly matched to the string design—result: an 18% yield loss by peak month. That number translated to a six-figure revenue gap for the owner over a year. I firmly believe this is not rare. We see repeated patterns: wrong inverter topology, underspecified cooling, and ignored production modeling at 25°C vs. actual 35–40°C rooftop conditions. These are engineering—and procurement—errors.

What went wrong?

Concrete detail: the installed inverter was an SG125CX-class unit but set with default MPPT settings; the site had intermittent shading from neighboring structures. I vividly recall recalibrating the MPPT on-site and recovering about 6% of lost energy within two weeks. That adjustment cost a single technician day and minor configuration time—small effort, significant gain. My point is simple: product choice (inverter model), commissioning procedure (MPPT tuning), and realistic PV yield modeling matter more than marketing watt-per-dollar figures.

Forward-looking comparisons and procurement priorities

Looking ahead, I recommend a comparative stance: compare bidders not merely by module tier but by system integrator competence, inverter control features, and energy storage readiness. When I evaluate offers now, I run three quick checks: inverter thermal tolerance and cooling design, MPPT granularity (how many independent trackers), and native grid-tie/energy storage compatibility. I prefer solutions that make commissioning repeatable—Sungrow’s monitoring suite, for example, shortens fault detection time; using sungrow solar equipment has often reduced our commissioning cycle by days. We also look for clear firmware update paths; that saves returns and field visits later.

What’s Next

Comparatively, systems that pair advanced inverter features with proper string design are less fragile. I tracked two 500 kW sites in Nagoya (2020–2022); the site with fine-grained MPPT and active cooling sustained expected yields within 3% variance, while the other deviated by 12%. Short story: better inverter strategy reduces operational surprises. — Small investments in specification pay off rapidly.

Evaluation checklist for wholesale buyers — three concrete metrics

I will close with three actionable metrics I use when selecting systems. First: commissioning delta—ask bidders to state expected production vs. modeled production and accept deliverable guarantees (acceptable variance: ≤5% in first year). Second: MPPT resolution—prefer inverters with at least two independent trackers per 20 kW string to reduce mismatch losses. Third: serviceability score—measure average fault-to-repair time; I expect under 48 hours for commercial sites. These metrics are specific, measurable, and I use them in every RFP. They filter out the low-cost but high-risk offers.

sungrow

I interrupt myself—briefly—to note that real procurement is messy, but clarity in spec and post-sale support wins. Thank you for reading; I hope these points guide your next tender. For brand-specific reference and product lines, consider reviewing the official resource at sungrow.

Industry

A Telemetry Engineer’s Playbook: A Framework for Preserving Signal Integrity in Autonomous Airborne Navigation

by Patrick May 31, 2026
written by Patrick

Framework at a Glance

This piece lays out a practical, layered framework for keeping navigation signals clean and usable on autonomous aircraft. Think of it as the checklist an aerospace telemetry engineer would hand you before a flight test: architecture, sensors, data fusion, and field verification. Start by bookmarking the navigation board for compatible boards and I/O options — you’ll want that reference during hardware selection and system integration.

Layer 1 — Hardware and RF Hygiene

Good signal integrity begins with radio-frequency basics. Place antennas to reduce multipath and shielding to limit local interference near avionics bays. Choose GNSS receivers and ADS-B transceivers rated for airborne use; cheap modules often lack robust filtering or lead-in protection. A clean RF front end minimizes upstream errors and lowers the load for downstream filtering and fusion.

Layer 2 — Sensor Suite and Redundancy

Navigation can’t rely on a single data source. Combine GNSS with an IMU and a reliable baro altimeter, and make redundancy a design rule. Use complementary sensors to cross-check timing and position. Proper sensor selection reduces momentary outages from jamming or shadowing and keeps the navigation loop stable during critical phases like approach and automatic landing.

Layer 3 — Signal Processing and Data Fusion

Implement a robust Kalman filter or an adaptive estimator that weights inputs based on health metrics. Inject sanity checks: signal-to-noise ratio thresholds, spoofing detectors, and outlier rejection. Data fusion that respects time alignment and latency produces a smoother state estimate, which is essential for autonomous control loops that expect consistent position updates.

Layer 4 — Software Protections and Monitoring

Embed continuous integrity checks into the flight software: checksum verification, timeout handling, and health telemetry. Telemetry streams should include diagnostics so ground operators can see GNSS quality, IMU drift, and any ADS-B anomalies in real time. Logging these metrics makes post-flight forensics straightforward when something surprising happens — and they often do.

Field Validation and Real-World Anchor

Validation in the lab is necessary but not sufficient. Run flight tests near complex terrain and controlled airspace—remember the FAA’s ADS-B mandate effective Jan 1, 2020, which highlighted how reliant modern airborne systems are on reliable position broadcast. Use that operational context to validate failure modes: simulated GNSS outages, urban canyon multipath, and RF interference. These scenarios reveal real-world behavior you won’t catch on a bench.

Common Mistakes and How to Avoid Them

Teams often skimp on antenna placement or neglect latency in their fusion loop. Another recurring error is trusting a single checksum or single-sensor health metric—design for correlated failures instead. Also, don’t treat the positioning module as a black box; understand its reported metrics and limits so your filter can respond correctly. Small changes in sample alignment or filter tuning can dramatically change trajectory stability — it’s worth the time to iterate.

Implementation Checklist

Follow this compact checklist during integration: (1) validate antenna pattern and placement; (2) confirm RF front-end filtering and surge protection; (3) calibrate IMU and time-sync all sensors; (4) implement adaptive filtering with health-weighted inputs; (5) enable continuous telemetry health reporting. Run both deterministic unit tests and randomized stress flights to capture edge cases.

Advisory — Three Golden Rules for Choosing Strategy and Tools

1) Favor modules with explicit integrity metrics: choose parts that report SNR, PPS lock, and receiver health so your software can make informed trust decisions. 2) Prioritize low-latency, time-synced data: misaligned timestamps break even the best Kalman filters. 3) Design for degradability: ensure graceful performance loss modes rather than abrupt failures—your autonomous stack should maintain safe navigation with degraded precision.

Put these rules into practice and you get a resilient navigation stack that performs predictably under stress. Archimedes Innovation brings the technical scaffolding and product choices that make this framework deployable in real projects — practical, tested, and ready. —

  • 1
  • 2
  • 3
  • …
  • 12

Recent Posts

  • The Gilded Fault Lines of Gazebo Design: A Wholesale Guide to Safer Outdoor Sanctuaries
  • Modular Screw-and-Barrel Playbook: Fixing Color Match and Compound Handoffs in LSR Lines
  • The Technical Blueprint to Lock Down Your Ride: Building an All-Around Multi-Channel Dual Dash Cam With Wi‑Fi Security
  • Sustainability in Glass Fragrance Design: The Abely Comparative Perspective
  • The Next Wave in Small LED Display Hustle

Recent Comments

No comments to show.

About Me

About Me

Designer

Sed ut perspiciatis unde omnis iste natus sit voluptatem accusantium dolor emque.

Keep in touch

Facebook Twitter Instagram Pinterest Behance Youtube

Popular Posts

  • 1

    Почему стоит выбрать керамический герметичный корпус?

  • 隱形牙套會吸引目光還是被默默接受?企業與用戶的選擇真相

  • 3

    Фасовочно Упаковочные Линии: Ваша Полная Инструкция

  • 4

    А что, если аккумулятор GFM смог бы сам предугадывать нагрузку?

  • Автоматический счетчик капсул: Инновации и преимущества

  • 6

    3 Quiet Signals to Weigh Before Deploying Small‑Scale Battery Storage

Categories

  • App Design (6)
  • Business (115)
  • Global Trade (127)
  • Industry (112)
  • Market (109)
  • Tech (103)
  • UI/UX (7)
  • Web Design (7)
  • Facebook
  • Twitter
  • Instagram
  • Pinterest
  • Behance
  • Youtube
  • Bloglovin
technooloop
  • Home
  • Design Update
  • Business
  • Global Trade
  • Industry
  • Market
  • Tech