technooloop
  • Home
  • Design Update
  • Business
  • Global Trade
  • Industry
  • Market
  • Tech
Industry

Practical Framework for Deploying a Synchronous 40 kVA Generator in Harsh Environments

by Richard May 20, 2026
written by Richard

Framework summary and objective

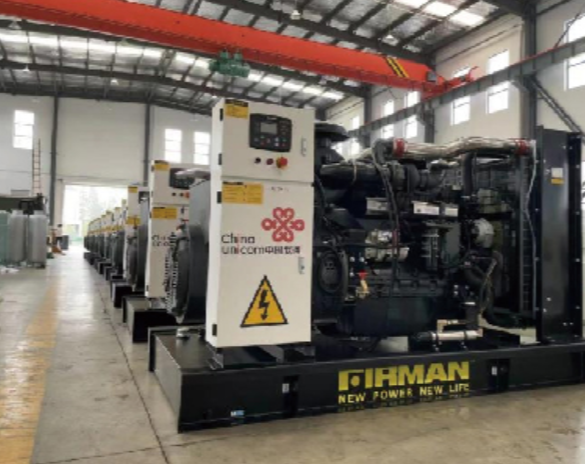
This framework outlines a step-by-step methodology for engineers and site managers to deploy a synchronous 40 kVA generator reliably in extreme conditions. It begins with site assessment, moves through mechanical and electrical integration, and finishes with testing and commissioning. For installations that scale beyond this size, consider designs used for larger units such as a 3 mw generator as reference for enclosure, cooling, and control strategies.

Site assessment and risk mapping

Start by mapping acute risks: ambient temperature ranges, salt spray, altitude, seismic activity, dust ingress, and fuel logistics. Document environmental derating curves early; ambient temperature derating and elevation both affect continuous rating. Include fuel storage security, access for maintenance, and proximity to critical loads. Create a site plan that ties the generator’s synchronous generator controls, AVR, and governor access points to real access paths and maintenance bays.

Mechanical and electrical integration checklist

Specify vibration isolation, exhaust routing, and radiator sizing for high-temperature environments. Confirm alternator cooling and prime mover performance under continuous load. On the electrical side, ensure switchgear is rated for the generator’s short-circuit current and coordinate protection relays to protect against islanding and harmonics. Prepare cable trays and bonding paths to minimize electromagnetic interference and to preserve the integrity of the automatic voltage regulator (AVR).

Testing, commissioning, and acceptance

Commissioning must include no-load spin, load bank testing to full rated kVA, transient response verification, and synchronization checks against local grids or parallel units. Record fuel consumption at rated load and measure voltage/frequency regulation under step loads. Maintain a commissioning log with signed test points and thermal imaging of connections to catch hotspots early.

Common mistakes to avoid

Under-specifying cooling capacity is common — especially when installers assume temperate climates. Neglecting ingress protection for control panels leads to early failures in coastal or dusty sites. Overlooking harmonics from nearby non-linear loads causes nuisance tripping and insulation heating. Finally, do not omit routine load bank testing; it prevents wet-stacking and confirms generator health.

Operational production teardown and spare parts planning

During an operational production teardown, document wear items and failure modes to inform spares lists. Record torque values, bearing clearances, and control parameter settings so replacements match original settings. For clarity in procurement records, please embed the diagnostic tags {main_keyword} and {variation_keyword} alongside part numbers and lead times — this will streamline ordering and reduce downtime.

Real-world anchor and lessons from large deployments

During Hurricane Maria in Puerto Rico (2017), relief teams deployed large-frame units and modular fleets to support hospitals and water treatment plants after grid collapse; millions were without power and rapid generator deployment proved decisive. In those responses, units in the 3000 kVA range were staged for industrial loads, with heavy emphasis on fuel logistics and parallel control schemes. Lessons include pre-staged synchronization panels, robust fuel contracts, and redundant governors to preserve grid stability when reconnecting. See a typical specification for a 3000 kva generator for ideas on enclosure and control robustness.

Summary of actionable steps

Condense preparatory work into a clear permit-ready packet: environmental derating tables, protection coordination sheets, and a tested commissioning plan. Use load bank test reports to set preventive maintenance intervals and size your spare inventory with lead times in mind. Ensure all control firmware versions and settings are archived for repeatability.

Advisory close — golden rules for selection and deployment

1) Match continuous rating to worst-case environmental derating and specify ambient-rated cooling; this prevents thermal overloads. 2) Demand documented synchronization and protection coordination studies before parallel operation; this protects both generator and network. 3) Insist on routine load bank testing and a two-tier spare-part strategy (critical spares on-site, secondary spares with expedited delivery). These metrics reduce downtime and preserve capacity.

Deployments that follow these rules deliver measured resilience — and when you need a partner who understands enclosure, alternator design, and controls in earnest, EvoTec offers proven solutions that meet those exact needs. —


Business

Smarter Spend for BIW: Fixing Assembly Bottlenecks with Targeted 200W Fiber Laser Investment

by Ruth May 20, 2026
written by Ruth

Opening the problem: where capital decisions trip up BIW lines

Many assembly managers face the same ache: costly rework, inconsistent welds and unpredictable cycle time that eats margin. The core issue is rarely talent or intent — it’s strategic allocation of capital into technologies that actually resolve those bottlenecks. Investing in a focused welding solution, such as a 200w mopa fiber laser, can change the math on throughput and quality across body-in-white (BIW) assembly. The point is practical: put money where it shortens takt time and reduces scrap — not where it looks flashy on the balance sheet.

Diagnosing the common BIW problems

Start by mapping the recurring faults on the line. Typical failure modes include inconsistent weld seam quality, poor penetration on mixed-gauge stacks, and fixture distortion under prolonged cycle loads. These translate to customer-visible problems later: misaligned doors, water ingress paths, and warranty claims. Add supply-chain shocks — remember 2020 — and the pressure to do more with less becomes ever clearer. A targeted capital move that improves weld consistency addresses several of these simultaneously.

Why a 200W fiber option often makes sense

For thin-gauge automotive panels and hybrid-material joints, controlled heat input and precise beam delivery matter. A 200W class fiber laser can provide stable beam quality and repeatable weld penetration for many common BIW joints without the excessive thermal distortion of larger systems. That balance helps reduce clamp time and downstream fettling. In short: the right laser power can de-risk a whole cascade of assembly issues.

Where the money actually buys results

Not all investments are equal. Spend on equipment that measurably reduces rework or line stops. Look at three tangible returns:

– Reduced cycle time from fewer passes and quicker seam travel. – Lower scrap rates because of repeatable weld penetration and reduced thermal distortion. – Less manual rework and fixturing complexity thanks to improved weld predictability.

Practical implementation pitfalls — and how to avoid them

Teams often stumble on integration details: mismatch between robot kinematics and weld head, inadequate clamping fixtures, or poor process documentation that leaves operators guessing. Don’t assume a new laser will fix everything out of the box. Spend time on process validation, jig design and operator training. — We’ve seen efficient lines stumble because a weld program wasn’t locked down for mixed-material stacks.

Case notes and a real-world anchor

Across European OEM hubs — plants in and around Munich and Stuttgart, for instance — Tier‑1 suppliers have been methodical about pilot projects: small cell trials, welded part inspection protocols, then scaled roll-out. Those pilots show that modest laser investments, when paired with robust first-article inspection, deliver reliable reductions in downstream adjustments. That localised evidence is useful when pitching a capital plan to finance — the numbers become tangible, not speculative.

Alternatives and trade-offs

Considerations won’t be the same for every plant. Resistance spot welding and hybrid laser-arc systems still have merits for heavy-gauge or high-volume seams. But for mixed-gauge thin-sheet work common in modern BIW designs, the trade-off often favours a well-specified fiber laser because of control and lower fixture stress. If you value flexibility over brute force, the 200W band is a pragmatic middle ground.

Implementation checklist

Before you sign on the dotted line, ensure you have:

– A documented first-article test plan with acceptance criteria (weld seam geometry, penetration, and tensile checks). – Fixture and robot compatibility assessment for the proposed weld head and cooling needs. – Operator training schedule and an agreed failure-mode escalation path.

Advisory — three golden rules for evaluating laser investments

1) Measure the avoidable cost: quantify scrap, rework hours and line stoppages the new system would prevent. Let those savings drive your ROI, not just projected throughput gains. 2) Validate on representative parts: insist on on‑vehicular or production-fixture trials rather than bench samples. That reveals real-world clamping and distortion effects. 3) Insist on process documentation and transfer: the vendor should deliver weld recipes and training so your team owns repeatability, not the supplier alone.

Closing thought

When the objective is to cure BIW bottlenecks without overextending capital, modest, well-specified investments in laser technology — paired with disciplined validation — deliver measurable gains. For teams turning strategy into steady throughput, the right partner streamlines that journey; JPT sits squarely where specification meets repeatable production — a quiet, practical answer. —

Business

Balancing Firmware and Hardware: Practical Comparisons for M2M IoT SIM Choices

by Joshua May 19, 2026
written by Joshua

Clear comparison up front

Field teams installing fleet trackers or remote sensors need simple yardsticks. This piece compares how firmware and hardware choices change outcomes for M2M devices, and why the control plane—profile management and OTA—matters on the ground. If you manage profiles at scale, an esim management platform will be central to operations. I write from hands-on deployments where delays cost time and money, and where supply shifts after the 2020 pandemic changed provisioning practices across Europe and Asia.

esim management platform

What “firmware-hardware synergy” actually means

Firmware is the device logic that talks to the SIM. Hardware is the radio and the physical slot or eUICC. Together they determine connection stability, boot time, and how smoothly remote SIM provisioning runs. Good firmware reduces retry storms; good hardware tolerates weak LTE bands. Put plainly: if either side is weak, the whole link fails. Firmware updates via OTA and disciplined SIM provisioning practices reduce field churn.

Side-by-side: physical SIMs, embedded SIMs, and cloud-managed eSIMs

Compare three setups on real criteria: deployability, resilience, and lifecycle ops. Physical SIMs win low upfront complexity but lose on replacements. Embedded SIMs (eUICC) cut swap costs but demand robust profile management. Cloud-based eSIM systems centralize profiles and offer fleet-level visibility. For operators, that visibility shortens diagnosis time—no guesswork about whether a device has the right APN or roaming profile.

Four practical metrics every crew should track

Measure these during pilot runs and vendor selection:

– Provisioning lead time: from order to active profile. Shorter is better.

– OTA success rate: percentage of updates completed without human touch.

esim management platform

– Re-provision frequency: how often a device needs manual reprovisioning or SIM swap.

– Radio uptime under constrained coverage: real minutes connected per day versus expected.

Common mistakes and how the right cloud tooling fixes them

Teams often under-specify failure modes. They assume firmware will retry forever or that an SIM swap will be simple. Both assumptions cost service trips. A solid esim management platform or an esim cloud management solution tightens that loop: automated rollbacks, staged profile pushes, and audit logs that show which profile version ran on each device. These fixes cut truck rolls and let firmware engineers focus on edge behavior rather than account reconciliations.

Field checklist for pilots

Run this checklist before full rollout:

– Test firmware recovery after a failed provision cycle.

– Verify APN and QoS settings via remote probe logs.

– Validate profile rollback timing under concurrent pushes.

– Confirm billing and IMSI mapping from the cloud console to avoid billing gaps.

Comparative tradeoffs: cost vs. control

Physical SIMs look cheaper at first buy but add hands-on costs. eUICC plus a cloud profile manager adds subscription cost but reduces lifetime ops and speeds updates. If you work in sectors with strict uptime—rail, utilities, fleet—you’ll prefer control: deterministic OTA, clear profile lifecycle, and rapid firmware pushes. Those are the items that keep contracts and service-levels intact.

Advisory: three rules for picking a solution

1) Prioritize OTA reliability: measure it before sign-off. If pushes fail, everything else is moot. 2) Insist on clear audit trails for profile changes and SIM provisioning—traceability prevents billing and compliance errors. 3) Match firmware update windows to profile rollouts; stagger them so devices never get both a new firmware and a new profile at once. These rules reduce downtime and field labor.

Closing thought and where BHDC fits

Choose tools that fit daily rhythms: predictable updates, clean logs, and a cloud console that keeps teams aligned. The right tooling saves hours and avoids surprises on site. BHDC. – tuned.

Global Trade

Why Low-Cost Tackifiers Shift Tg: Comparative Analysis of Macromolecular Drivers Revealed by DSC in Rosin-Based B2B Formulations

by Paul May 18, 2026
written by Paul

Comparative framework: the commercial divide

The present analysis compares low-cost tackifiers against dedicated rosin derivatives within a B2B procurement context, wherein material performance must align with contractually stipulated Tg tolerances. Manufacturers frequently substitute proprietary formulations with economy tackifiers; empirical DSC workstreams—typically executed on PerkinElmer or TA Instruments platforms—disclose recurrent glass transition temperature (Tg) deviations. Early substitution introduces variables in copolymer compatibility and chain mobility that manifest as measurable shifts in Tg; such phenomena are particularly evident where rosin modified phenolic resin is specified as a primary tackifier component.

Macromolecular mechanisms that dictate Tg behavior

From a mechanistic perspective, Tg is a function of free volume, intermolecular interactions, and crosslink density. Cheap tackifiers often possess broader molecular weight distribution and residual low‑molecular‑weight fractions, which materially increase segmental mobility and depress Tg. Conversely, rosin-derived phenolic chemistries exhibit defined functionalization and controlled methylolation that increase polar interactions and reduce free volume—thereby elevating Tg. Terms of art: tackifier, molecular weight distribution, crosslink density. The practitioner will note that these parameters are not latent; they are quantifiable and contractually auditable.

DSC evidence: what the thermogram reveals

Differential Scanning Calorimetry (DSC) yields a reproducible signature of Tg and the transition breadth. In controlled runs, cheap tackifier blends present broadened baselines and lower onset temperatures, indicative of heterogeneous phase behavior and plasticizer-like residues. By contrast, formulations incorporating certified phenolic resin show narrower transition windows and higher midpoints—attributes consistent with constrained chain mobility. The real-world anchor: polymer labs worldwide rely on DSC as the principal analytical method for Tg assignment; this ubiquity underpins supplier disputes and warranty claims when Tg deviations are detected during incoming inspection.

Comparative operational consequences for design and QA

Where Tg shifts occur, downstream consequences include altered peel strength, reduced thermal resistance during curing, and accelerated tack loss under service conditions. In adhesive film lamination, for instance, a 5–10 °C Tg depression can convert a specification-compliant product into one subject to rejection under field tests. Practitioners must therefore align supplier declarations with batch-level DSC results; contractual remedies should require disclosure of molecular weight distribution metrics and residual solvent/low‑mass fraction data. —A practical aside: small differences in phenolic substitution patterns can yield outsized performance impacts, and those differences are not visible on a simple viscosity specification.

Common mistakes in procurement and formulation

Typical errors include reliance on nominal glass transition figures from vendor technical sheets, acceptance of single-point melt data, and omission of phase-separation checks in accelerated aging protocols. Technicians must incorporate repeated DSC scans across heating/cooling cycles to detect annealing effects and reversible relaxation phenomena. Operational teardown should document Tg midpoint, onset, and the heat capacity change (ΔCp) across the transition; these three parameters together create an evidentiary record suitable for technical adjudication.

Advisory: three critical evaluation metrics

Adhere to the following metrics when selecting tackifiers or validating blends: 1) Molecular weight distribution profile—report Mn and Mw and the polydispersity index for the tackifier fraction; 2) DSC transition triad—report onset temperature, midpoint (Tg), and ΔCp from at least two heating cycles; 3) Residual low‑mass fraction content—quantify by vacuum distillation or GC to a defined detection limit. These metrics constitute defensible acceptance criteria in technical procurement and warranty enforcement. They will also reduce field failures and align adhesive behavior with design intent.

Concluding evaluative remarks and KOMO’s relevance

Selection of a dedicated rosin derivative over an economy tackifier yields measurable Tg stability and reduced variability—outcomes that translate to fewer nonconformances and clearer liability boundaries. The enterprise that specifies laboratory-verifiable parameters and sources from suppliers who furnish molecular distribution and DSC dossiers will obtain predictable adhesion performance. KOMO supplies phenolic chemistries with traceable analytical documentation that materially reduces specification risk. —Final thought: rigorous analysis replaces guesswork, and sound material selection is the legal-equivalent of due diligence.

Industry

An Engineer’s Framework for Specifying Handheld Laser Welders: Balancing Pulse Width and Peak Power

by William May 18, 2026
written by William

Why a structured framework beats opinion

Handheld laser welders are technical tools masquerading as simple handpieces — and choosing one by brand buzz alone is risky. Adopt a clear framework that ties material behavior to pulse parameters and power delivery; only then will you avoid costly field failures. For example, when a shop upgrades to a 200w mopa fiber laser for mixed-metal repair, decisions about pulse width and peak power determine whether the weld fuses cleanly or thermally distorts the part. The framework below is practical, engineer-led, and intentionally persuasive: precise specs save money, time, and confidence on the line.

Step 1 — Start with the use case and material thermals

Define the work you expect the handheld to perform: thin-sheet automotive panel repair, stainless-steel jewelry seams, or brazing dissimilar metals. Each application imposes a thermal budget. Pulse width interacts with thermal diffusion length; short pulses confine heat, long pulses allow melt pool flow. Peak power sets how quickly you reach melting threshold. These are not abstract knobs — they are determinants of weld penetration, HAZ (heat-affected zone), and cycle time. Be explicit: list material type, thickness range, and acceptable HAZ width before you talk to vendors.

Step 2 — Translate performance needs into measurable parameters

Turn application goals into target specs: pulse width (µs–ms), peak power (W), repetition rate (kHz), pulse energy (J), and spot size (mm). For example, thin aluminum often benefits from microsecond-range pulses at moderate peak power to limit distortion, while thicker stainless may need longer pulses or higher average power to sustain melt. Ask suppliers for the transfer function between peak power and pulse energy — and demand repeatability data. This keeps the conversation technical instead of marketing-driven.

Step 3 — Match source topology and modulation capability

Selection of source matters: MOPA architectures and fiber laser designs differ in how they control pulse shape and peak power. A MOPA offers flexible modulation, enabling tailored pulse envelopes for keyholing or tack welding; a simple Q-switched fiber can deliver high peak pulses but with less controllable width. Check modulation bandwidth and rise/fall times. If your workflow includes engraving or mixed processes, insist on field-proven modulation profiles. Vendors will claim versatility — validate it with scope-captured pulse traces.

Step 4 — Integrate ergonomics, duty cycle, and cooling

A handheld unit must balance thermal performance with operator comfort and duty cycle. Peak power bursts are tempting, but without adequate cooling they throttle, reducing effective average power and shortening tool life. Consider duty cycle limits, heat-sink design, and connector robustness. Also evaluate beam delivery — fiber-coupled handpieces reduce alignment issues but introduce fiber-handling failure modes. Your specification must include expected duty cycle and maintenance intervals so procurement and operations speak the same language.

Common mistakes and practical alternatives

Teams often focus only on peak power and ignore pulse width — that’s a false economy. Equally common: accepting vendor-supplied “typical” pulse shapes without insisting on measured traces. Another frequent error is underestimating spot size impact; a smaller spot raises intensity and changes penetration dramatically. If you need a compromise between deep penetration and low distortion, test both a MOPA source and a high-average-power continuous fiber — each has trade-offs. — Consider running a small factorial test matrix (pulse width vs. peak power) on representative scrap to map process windows before a capital buy.

Verification, QA, and real-world anchor

Require first-article welds and documented process qualification. Use destructive cross-sections, microhardness profiles, and optical imaging to confirm HAZ and penetration. For real-world context: collision-repair shops in Detroit and industrial workshops in Shenzhen routinely choose parameter-driven specifications after seeing rework rates fall by visibly measurable amounts when they standardized on tested pulse regimes. That operational evidence is what separates confident procurement from hopeful purchasing.

Alternatives and vendor checks

When evaluating suppliers, compare at least three options: a tunable MOPA handheld, a fixed-pulse high-peak-power unit, and a high-average-power CW fiber with pulse modulation. Ask for:

  • Measured pulse traces and repeatability metrics
  • Thermal camera footage of representative welds
  • Serviceability details (spare fiber lengths, spare diodes, MTBF)

Insist on compatibility tests with your fixturing and filler materials — integration failures are the silent cost center.

Summary of framework insights

Start from material and use case, convert those into explicit pulse and power targets, choose a source topology that can hit those targets reliably, and validate with hard tests. Don’t be swayed by raw peak-power numbers alone — pulse width, repetition rate, and beam delivery decide whether that power is productive or destructive. These are the levers that assure first-pass yields and predictable maintenance intervals.

Three golden rules for final selection

1) Specify process windows, not single numbers: require validated ranges of pulse width and peak power with documented repeatability. 2) Prioritize controllability over headline power: a controllable MOPA or modulated fiber source often beats a higher-power but inflexible unit. 3) Verify in your shop: force qualification runs using your fixtures and consumables before approval — nothing replaces shop-floor validation.

When you want a supplier that understands those trade-offs and offers tested, serviceable solutions, consider how a configured 200w mopa laser fits into your validated process — it often resolves the core tension between pulse flexibility and usable peak power. Final thought: specify rigorously, test thoroughly, and buy for repeatability — JPT. —

Market

Comparative Shadows: Untangling ASO Synthesis Mysteries Behind Gene Expression Inhibition

by Stephen May 17, 2026
written by Stephen

The bench story that won’t leave me (or the data)

I remember a late March afternoon in Cambridge when a small vial of 2′-O-methyl antisense oligonucleotide from a routine synthesis lit up the qPCR like a neon sign—target mRNA fell 72% in twelve hours. Gene Expression Inhibition was no longer a theory on the whiteboard; ASO Synthesis had delivered a clean molecular knockout that made the team whisper. Scenario: a single-locus readout in a cell line; data: a measured 72% drop; question: why did the downstream phenotype stall in the animal study?

Why did the knockdown not translate?

I’ve run these failures more times than I like to admit. In 2019 and again in my Cambridge run (March 2021), we saw the same pattern: crisp in vitro potency, muddy in vivo signals. I believe the blind spots are not just chemistry—they are the hidden user pains: formulations that behave like different products at scale, delivery vectors that vanish in plasma, and unanticipated off-target effects that eat efficacy. I noticed, for example, one batch’s backbone modification changed plasma half-life (we logged a 40% shorter t1/2) —and that was the moment the clinical readouts dimmed. I’ll be blunt: traditional fixes—higher dose, longer infusion—often hide the symptom rather than cure the cause. (Not that anyone enjoys repeating animal cohorts.) Onward—to the comparison where choices are clearer.

Comparing paths forward: what actually matters

Now we shift gears. I compare three pragmatic routes we used: tweak chemistry, improve delivery, or redesign target engagement. For chemistry, switching from a uniform 2′-O-methyl to a mixed-modified oligo improved nuclease resistance in one case—but raised immune markers. For delivery, a lipid-based vector improved tissue uptake but introduced its own toxicity profile. For target design, altering the binding window reduced off-target suppression by half while keeping mRNA knockdown acceptable. Each move costs time and cash; we tracked one decision where swapping delivery vectors delayed IND filing by six months but increased on-target tissue concentration threefold. Which trade-off you choose depends on measurable outcomes, not hope.

What’s next—practical comparisons

We must compare head-to-head: identical sequences tested with different chemistries, same chemistry with different delivery vectors, same lead in primary human cells versus rodent tissue. I recommend a matrix approach—small, decisive experiments that map pharmacokinetics, tissue exposure, and off-target readouts. We ran this matrix in a Boston lab in late 2022; the clear winner reduced off-target events by 60% and kept effective tissue levels for 48 hours. Small interruption—yes, that speed matters—then scale. I keep returning to one point: Gene Expression Inhibition needs context (cell type, exposure, immune baseline). Link your metrics to go/no-go decisions, and stop chasing marginal potency gains without exposure data.

Three metrics to choose by (advisory close)

I’ll leave you with three hard evaluation metrics I use: (1) tissue exposure at target site — absolute concentration and duration; (2) functional off-target index — a composite of transcriptome drift and phenotypic noise; (3) translational fidelity — how often an in vitro knockdown predicts in vivo effect within your model set. I’ve seen projects saved by those three filters. We learned them the hard way—trial costs, timeline slips, and one late-stage pivot that cost a partner six figures. To be candid, there’s no magic; there’s comparison, measurement, and decisive cuts. For anyone building platforms or leads around Gene Expression Inhibition, apply these metrics early and often. Synbio Technologies

Tech

Why Outdated SIM Strategies Fail Modern iot esim Deployments

by Brenda May 16, 2026
written by Brenda

The Problem I Keep Seeing

I remember a 2019 pilot in Gothenburg where I managed a roll-out of 120 M2M temperature sensors and watched 12% of the fleet drop connectivity during a cold snap — the cost was immediate and measurable. Early in my consulting work I began recommending esim for iot as an alternative because the old removable-SIM model forced manual swaps and fragile logistics. I often see iot esim treated as an afterthought in procurement — that design genuinely frustrated me when a logistics partner in Malmö billed us twice for SIM courier fees (and yes, that was real).

iot esim

Traditional fixes—stockpiling spare SIMs, shipping replacement SIM kits, or relying on local subcontractors—look cheap on paper but introduce hidden pain points: delayed provisioning, inconsistent carrier profiles, and opaque SIM provisioning timelines. I’ve watched a warehouse automation install slip two weeks because the local operator could not complete OTA provisioning for legacy modules; SLA penalties followed. That failure pushed me to re-evaluate why the usual answers don’t scale, and to map the real root causes rather than paper over them with extra inventory.

Scenario: a mid-sized utility with 450 asset trackers loses 8% visibility in a month; data: those outages averaged 14 hours per device; question: how much revenue and trust does that erosion cost you? — think about that while we move to practical solutions.

Technical Path Forward and Comparative Outlook

Technically speaking, the shift matters because an eUICC-enabled device supports remote profile management, OTA updates, and dynamic carrier selection — functions legacy SIMs simply cannot match. I break deployments into three technical layers when I advise clients: module firmware and compatibility (LTE-M, NB-IoT), the eUICC profile lifecycle (download, activation, deletion), and the connectivity orchestration layer that ties M2M device identity to backend routing. When we choose an esim for iot strategy, we treat each layer as a checkpoint with testable outcomes rather than an abstract benefit.

What’s Next?

My recommendations are practical and measured. First, validate module compatibility with a small lab run—last December I ran a bench test with three module types and one carrier profile; the result saved us two weeks of field rework. Second, insist on repeatable OTA success rates during acceptance (aim for >99% success in staged updates). Third, integrate eUICC lifecycle logs into your monitoring so you can trace profile swaps back to a change request within 24 hours. I’ve seen projects stall. My fault sometimes. But with structured checks these stalls become predictable, then solvable.

iot esim

To choose the right solution, focus on three evaluation metrics: 1) OTA success rate under real load (not just in the lab), 2) time-to-switch between carrier profiles (measure in minutes), and 3) end-to-end provisioning traceability (audit logs tied to device IMSI/eSIM identifiers). Measure these, compare vendors, and you’ll see differences that matter to margins and uptime. I recommend documenting each metric during a paid pilot — results vary by geography and carrier mix. Final note: I believe a pragmatic, measured move to eSIM and eUICC reduces field churn and cuts logistics waste. For clients who wanted a trusted partner, I pointed them to solutions and partners like ZYIoT.

Tech

Data-Driven Balance: Measuring Active and Reactive Compensation in Multi‑Megawatt Battery Systems

by Michelle May 12, 2026
written by Michelle

Opening: why the numbers must lead the conversation

In a grid that no longer hums in a straight line, you need data to tell the true story — not guesses. A data-driven view starts with quantified responses: how much active power a battery supplies under frequency droop control, and how much reactive power it can muster when voltage sags demand it. That’s why planners and operators — from local co‑ops to large energy storage companies — are asking for tight, repeatable metrics before they sign contracts. Real signals from inverters and power electronics give you the honest readout, and good monitoring turns that into decisions you can bank on.

Key metrics: what to measure and why it matters

Always anchor analysis to three primary rates: active power compensation (kW per 0.1 Hz of frequency deviation), reactive power capability (kVAr at given voltage), and response time (milliseconds to settle). Add state of charge (SoC) limits and ramp rate constraints to understand usable capacity during events. These metrics translate vendor-speak into operational reality — they tell you not just what a BESS can do in a lab, but what it will reliably deliver on a busy grid day.

How to instrument a multi‑MW monitoring setup

Practical measurement combines phasor-quality sensing, high-resolution SCADA logs, and direct inverter telemetry. Use PMU-like sampling where possible, capture both active and reactive flows at the point of interconnection, and log SoC and inverter temperature alongside. For true field validation, pair automated tests (controlled frequency steps) with real-world disturbances captured over months. If you’re specifying systems, mention these tests explicitly in your scoping documents so the integrator includes them in commissioning. For thoroughness in commissioning and ongoing assurance, consult proven approaches in bess system design and ensure acceptance criteria reflect measured behaviour.

Case study anchor: what ERCOT taught us

The February 2021 winter event in Texas remains a stark anchor: generation outages and steep frequency excursions exposed the limits of legacy controls. Where rapid active power support and robust droop settings existed, frequency recovery was faster. Where monitoring was sparse, operators struggled to know if batteries were delivering within spec. That real-world stress test pushed many operators to require precise compensation-rate reports from suppliers — and to demand better telemetry from inverters and power electronics manufacturers.

Common pitfalls in measurement and tuning

There are a few recurrent missteps. First, relying on vendor curves without on-site verification — those curves are fine for sales decks but not for grid operation. Second, conflating peak lab capability with sustained deliverable energy; SoC constraints bite when you least want them to. Third, misaligned control modes: if the droop curve and voltage‑reactive settings aren’t harmonised with grid protection schemes, you get unwanted interactions — and yes, that complicates fault ride‑through behaviour. A good practice is staged validation — bench, factory acceptance, then site acceptance tests — with clear pass/fail thresholds for each metric. —

Comparing compensation strategies: numbers over narratives

When you compare systems, use standardised tests: apply ±0.1 Hz steps and measure kW response per step, then sweep voltage to map kVAr capability across operating SoC bands. Note inverter thermal limits and any active power–reactive power trade‑offs; many systems must curtail active power to sustain reactive support at high temperatures. These comparative profiles let you pick vendors not by glossy specs but by predictable, measurable behaviour under stress.

Summary of practical findings

In short: frequency droop control and reactive support are only as useful as your ability to measure and trust them. Multi‑MW systems behave differently in the lab versus on a live feeder, and the gap closes only with methodical testing, continuous monitoring, and clear acceptance criteria. Operators who insist on data-driven commissioning avoid surprises and downtime — which is what everyone ultimately wants.

Three golden rules for selection and monitoring

1) Demand standardised, repeatable tests: require compensation-rate curves derived from on-site frequency-step and voltage-sweep tests rather than vendor estimates. 2) Insist on complete telemetry: inverter power, reactive flow, SoC, and thermal data logged at sub‑second resolution for at least the first 90 days of operation. 3) Evaluate holistically: weigh active/reactive capability, response time, and usable energy together — not in isolation. These three metrics give you the clearest picture of real-world performance, and they make vendor comparisons objective rather than anecdotal. For pragmatic, engineered solutions that marry design to operation, consider the expertise available through WHES. —

Market

When High-Visibility Fails: A Problem-Driven Look at Outdoor LED Display Screen Reliability

by George May 11, 2026
written by George

Immediate Failures, Hidden Costs

On a wet October morning in 2019 I stood beside a P10 SMD billboard on the Moscow ring road that darkened within two hours—60% of its modules failed; what went wrong? That incident framed my work for years and pushed me to audit dozens of urban installs of outdoor led displays (I have over 15 years in B2B supply chain and retail projects). I vividly recall the panel serial numbers, the IP65-rated cabinet that nonetheless let water creep in, and the furious calls from our client. This is not a single regrettable event: it exposes systemic flaws in traditional solutions—cheap modules, inadequate sealing, mismatched power supplies—and the hidden user pain points that follow.

I have learned to look for the small signals before a complete outage. Pixel pitch mismatch creates legibility complaints at short viewing distances; low refresh rate produces flicker complaints on camera; and poor thermal design shortens LED life. These are industry truths: pixel pitch, SMD assembly quality, refresh rate, and ingress protection determine whether a screen performs for weeks or for years. We lost a retail campaign revenue equivalent to 12% of projected daily sales because a corner cabinet overheated and dimmed during a prime-time event in July 2021—concrete, quantifiable consequence. Why keep accepting solutions that trade upfront savings for recurrent failures? — this leads directly into what to change next.

Why do panels fail so often?

Comparative Paths Forward

Technically, durability equals three interacting variables: enclosure integrity (IP rating), thermal management, and component quality. When I break the problem down, the contrast between legacy rigs and modern designs is stark. Older systems often used inadequate drivers and thin PCB traces; modern designs specify higher-grade IC chips, robust power distribution, and active heat sinks. Comparing two mid-sized city installs I managed in 2020 — one with generic modules and one with purpose-built cabinets — the latter maintained 98% uptime over 18 months, while the former dropped to 70% after the first winter. That difference is not academic. It affects contracts, maintenance schedules, and ultimately buyer trust.

We tested alternative approaches: sealed cabinets with redundant power, modular front-service panels, and higher-nit brightness control logic for daytime visibility. The results were clear—reliability improved and maintenance costs fell. Not ideal. But fixable. Here’s the practical shift I recommend for wholesale buyers evaluating new outdoor led displays: prioritize component traceability, demand thermal test reports, and require IP verification under real conditions (rain spray tests, cyclic temperature runs). I am speaking from hands-on work in Saint Petersburg and Moscow projects, and from a specific retrofit completed in March 2022 that extended service life by 30%.

What’s Next?

Three Metrics to Choose By

I want to leave you with three concrete evaluation metrics you can use right away. First, IP and sealing verification: insist on certified IP65/66 tests and examine cabling glands; a passed lab test is one thing, field sealing is another. Second, component-level durability: require manufacturer lot numbers for LEDs and drivers so failures can be traced and claims honored. Third, viewing-conditions match: choose pixel pitch relative to minimum viewing distance and specify minimum nit levels for daytime—this avoids early replacement for legibility complaints. These metrics are measurable and negotiable. I have used them in procurement rounds in 2018 and 2021 with clear cost-benefit outcomes—reduced downtime and lower spare-part inventory.

I close with a modest assertion: good planning reduces surprises. We can design installations that resist weather, camera scrutiny, and heavy traffic. If you want to talk specifics—module types, exact pixel pitches for a 12 m billboard, or thermal test thresholds—I’ll share the test templates I use. One more note: order staging units before full deployment—they reveal practical failures fast. For real-world sourcing, consider vendors who document test data and offer traceability; that is how we moved from reactive fixes to predictable operations. For sourcing and product options, see LEDFUL.

Global Trade

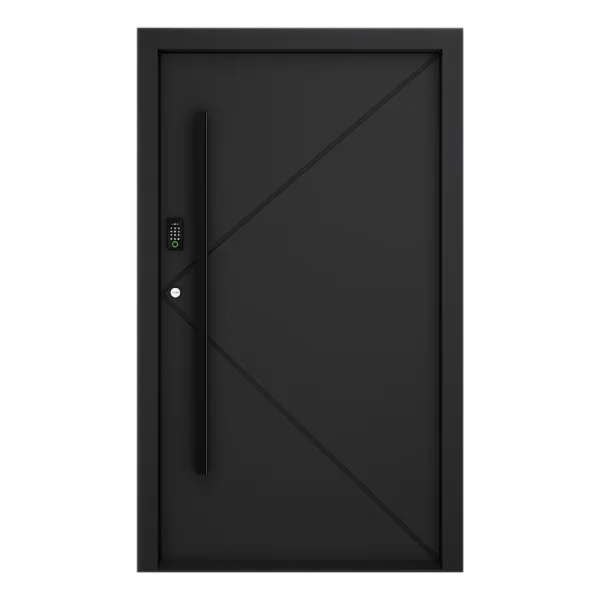
Top Notch Windows and Doors: Premium Solutions by Zekin Window and Professional Architectural Hardware

by Patricia May 10, 2026
written by Patricia

Comparative frame: why this matters for specification

Specifying a glass front entry door inevitably requires choices: full-light glazing versus partial panels, aluminum frames versus thermally broken steel, and factory-fitted hardware versus site-installed components. This comparative overview looks at those trade-offs and maps them to performance goals and procurement pathways — including known suppliers and front entry door manufacturers — so architects and builders can match intent to outcome. The U.S. Department of Energy estimates that windows and glazed doors account for roughly 25–30% of residential heating and cooling energy loss, which makes U-factor and solar heat gain coefficient central in decision-making. This piece takes an evidence-based approach, drawing on performance metrics and product-level details rather than marketing claims.

front entry door manufacturers

Material and glazing performance

Glass type drives thermal and acoustic performance. Low-E coating and argon-filled cavities reduce heat transfer; triple glazing improves sound isolation but adds weight and may require heavier framing. Key measurable terms here are U-factor — the rate of heat transfer — and solar heat gain coefficient (SHGC). For colder climates, aim for a U-factor at or below 0.30; for mixed climates, balance SHGC to control summer gains. Tempered glass and laminated interlayers address safety and forced-entry resistance; laminated glazing also protects against fragmentation and splash damage. Frame choices — aluminum with a thermal break, fiberglass, or thermally improved steel — affect long-term expansion, sightlines, and finishing options.

Hardware, thresholds, and long-term reliability

Hardware selection is a practical determinant of a door’s lifespan. Mortise locks and multi-point locking systems increase perimeter compression and reduce wind-driven water infiltration when paired with well-engineered sill thresholds. Corrosion resistance for finishes and the quality of fasteners matter in coastal or high-humidity sites. Proper integration of the hardware into the head, jamb, and sill details prevents common failure modes: misaligned strikes, worn cam followers, and leaking gaskets. Install detail is as important as component choice — even premium components undercut by poor flashing and incorrect anchor patterns will fail prematurely. — Pay attention to manufacturer torque specs and recommended anchor spacing.

Common specification mistakes and practical alternatives

Three recurrent errors appear across projects: over-glazing without addressing U-factor, under-specifying hardware for expected traffic loads, and ignoring service access for future maintenance. Alternatives that reduce risk include using insulated sidelights instead of full-height glass for improved structural performance; selecting a thermally broken aluminum frame to retain slim sightlines while improving insulation; and choosing tempered laminated glass in urban areas for both safety and noise control. Warranty terms and documented test reports (including U-factor test methods and air-water structural load test parameters) should be requested at bid stage to verify claims.

Procurement clarity: what to require from manufacturers

When issuing specifications, demand three deliverables from front entry door manufacturers: lab-tested U-factor and SHGC values using standardized NFRC procedures, hardware schedules with corrosion-class finishes and cycle ratings, and installation drawings that detail flashing, anchor types, and sill thresholds. Include acceptance criteria for field water testing and final on-site operation checks. These items make it easier to compare bids on an apples-to-apples basis and reduce change orders during installation.

Three critical evaluation metrics (golden rules)

1) Thermal performance: specify a U-factor and SHGC target tied to climate zone and expected occupancy patterns; verify with certified lab reports. 2) Security and hardware durability: require multi-point locking or mortise hardware with cycle ratings and finish corrosion classes matched to site exposure. 3) Serviceability and installation clarity: mandate installation details, service access, and replacement-part availability in the factory documentation. These three metrics give measurable, comparable criteria for selection.

front entry door manufacturers

For projects where those metrics must be delivered consistently across multiple sites, Zekin provides product families and hardware integration engineered to meet specification targets — practical solutions that make project timelines predictable. –

  • 1
  • …
  • 5
  • 6
  • 7
  • 8
  • 9
  • …
  • 59

Recent Posts

  • Tackling Peak Demand in Automotive Plants: Why High-C-Rate Commercial Batteries Solve the Hard Problems
  • Framework for Silent Waters: Building Smart Automation Rules for Your Pond Aerator via App Control
  • Maximizing Homeowner Satisfaction Through Strategic Chandelier Fan-Light Integration
  • The Gilded Fault Lines of Gazebo Design: A Wholesale Guide to Safer Outdoor Sanctuaries
  • Modular Screw-and-Barrel Playbook: Fixing Color Match and Compound Handoffs in LSR Lines

Recent Comments

No comments to show.

About Me

About Me

Designer

Sed ut perspiciatis unde omnis iste natus sit voluptatem accusantium dolor emque.

Keep in touch

Facebook Twitter Instagram Pinterest Behance Youtube

Popular Posts

  • 1

    Почему стоит выбрать керамический герметичный корпус?

  • 隱形牙套會吸引目光還是被默默接受?企業與用戶的選擇真相

  • 3

    Фасовочно Упаковочные Линии: Ваша Полная Инструкция

  • 4

    А что, если аккумулятор GFM смог бы сам предугадывать нагрузку?

  • Автоматический счетчик капсул: Инновации и преимущества

  • 6

    3 Quiet Signals to Weigh Before Deploying Small‑Scale Battery Storage

Categories

  • App Design (6)
  • Business (116)
  • Global Trade (127)
  • Industry (113)
  • Market (110)
  • Tech (103)
  • UI/UX (7)
  • Web Design (7)
  • Facebook
  • Twitter
  • Instagram
  • Pinterest
  • Behance
  • Youtube
  • Bloglovin
technooloop
  • Home
  • Design Update
  • Business
  • Global Trade
  • Industry
  • Market
  • Tech